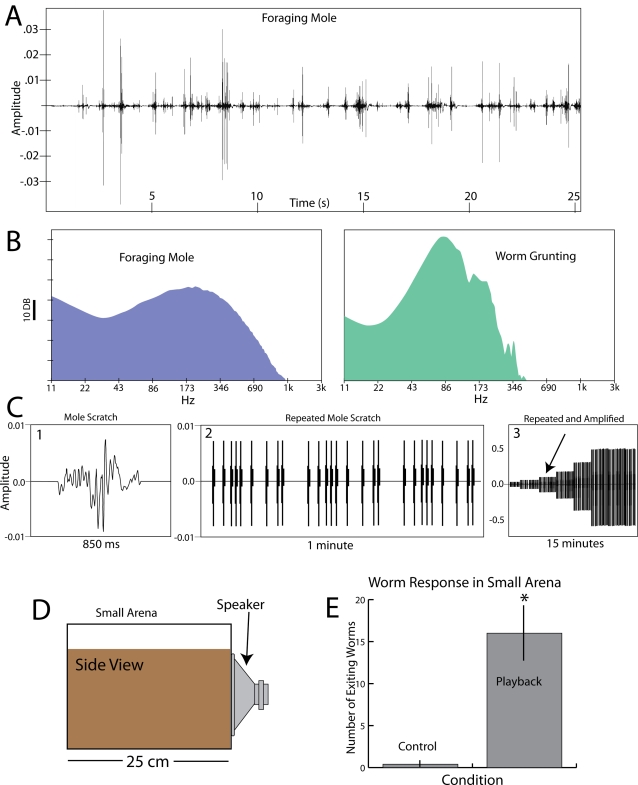
Figure 6. Vibrations caused by a foraging mole and earthworm responses.
A. Vertical geophone recording of a wild, foraging mole in Davidson county TN, from a distance of approximately 15 cm (see supplementary audio file S2). B. Representative spectrums of a foraging mole (from the first 23 seconds of the recording above) and a worm grunter (from the segment in figure 1C). C. Recording of a single scratch from a foraging mole (1). This scratch was repeated multiple times (2) and then amplified over time (3) to simulate a digging mole. Arrow marks the point in the playback at which earthworms consistently emerged from the soil. D. Small arena used in playback experiments. E. Results of playback experiment. In 5 trials and average of 16 earthworms surfaced in response to the simulated mole. * indicates a significant difference (t(8) = −4.712, p<0.005, indicating significant difference between digging mole and control period (see methods).

