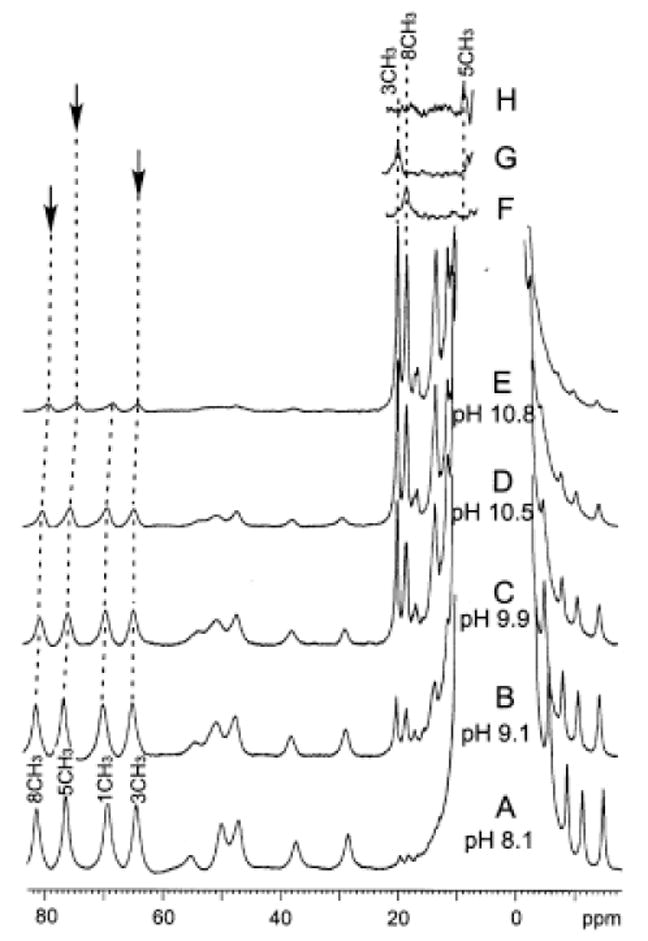
Figure 3.

Resolved portions of the 500 MHz 1H NMR spectrum of NmHO-PH-H2O/OH at 25°C as a function of solution pH. The predominant NmHO-PH-H2O complex with its assigned residues is shown at (A) pH 8.1; (B) pH 9.1; (C) pH 9.9; (D) pH 10.5 (6%:94% NmHO-PH-H2O:NmHO-PH-OH) and (E) pH 10.8. The magnetization-transfer difference spectra for NmHO-PH-OH upon saturating the assigned NmHO-PH-H2O heme methyl 50 (as indicated by vertical arrow) are shown for the (F) 8-CH3, (G) 3-CH3; and (H) 5-CH3.
