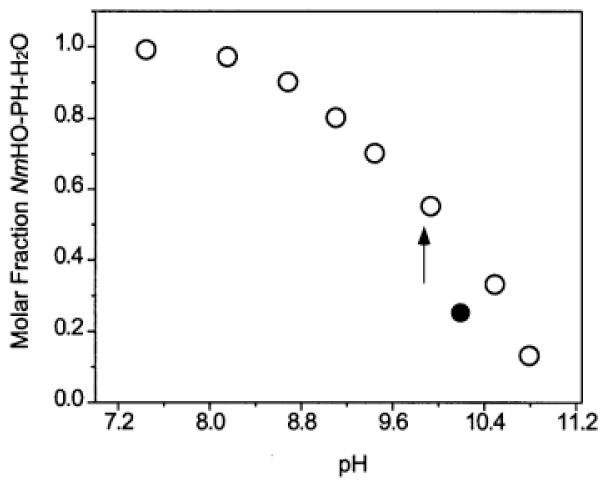
Figure 4.

A Henderson-Hasselbalch plot (mole fraction NmHO-PH-OH in NmHO-PH-H2O/NmHO-PH-OH mixtures as a function of pH) in 2H2O solution, at 25°C, as determined from the relative intensities of the heme 3-CH3 signal in the two complexes. Data in 2H2O are shown as open circles. The estimated pK ~9.8 in 2H2O is shown by a vertical arrow. The single data point recorded in 1H2O solution at pH 10.2 is shown as a closed circle.
