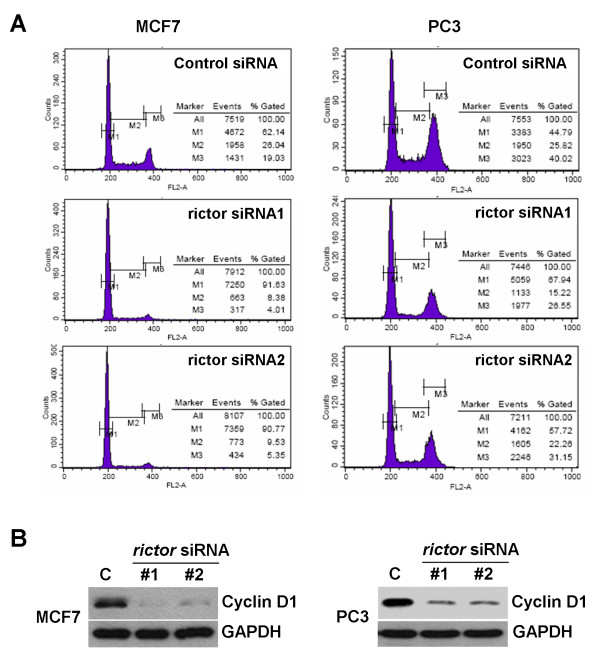
Figure 4.
Accumulation of cells in G1 phase upon rictor depletion correlates with downregulation of Cyclin D1. (A) Flow cytometry histograms showing accumulation of cells in G1 phase after depletion of rictor. Cells were treated with siRNAs for five days, fixed with ethanol, stained with propidium iodine. DNA content was analyzed by flow cytometry. M1: G1, M2: S, M3: G2/M phase. (B) Cells were treated with control or rictor siRNAs for five days. Cyclin D1 levels were analyzed by immunoblotting with anti-CyclinD1. GAPDH was used as loading control.

