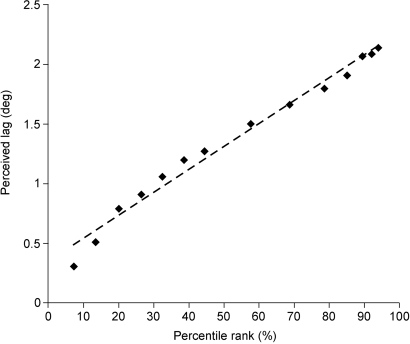
Fig. 6.
Predicting the flash-lag effect. Plotting the perceived lag reported by observers in Fig. 4 against the percentile rank of speeds in Fig. 5B shows the correlation between the psychophysical and empirical data. The deviation from a linear fit (dashed line) indicates that ≈97% of the observed data are accounted for on this basis (R2 = 0.9721).

