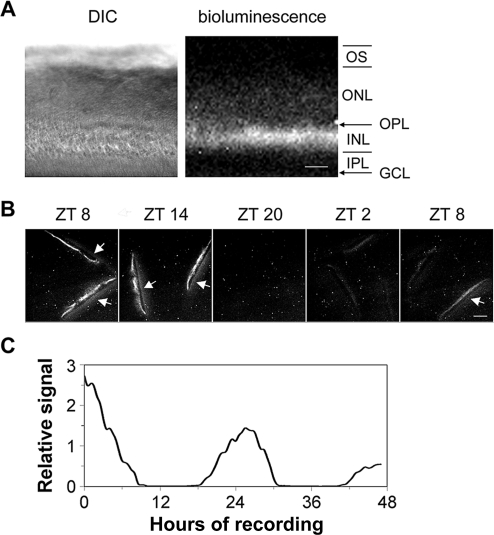
Figure 2. Circadian Oscillation of PER2::LUC Bioluminescence in the Inner Nuclear Layer.
(A) DIC image (left panel) and luminescence image (right panel) of a vertical retinal slice. Retinal slices were prepared around ZT 4, incubated in CO2 incubator for 1 d, and then imaged. Note that bioluminescence signals were primarily located in the inner nuclear layer. GCL, ganglion cell layer; INL, inner nuclear layer; IPL, inner plexiform layer; ONL, outer nuclear layer; OPL, outer plexiform layer; OS, photoreceptor outer segments. Scale bar represents 50 μm.
(B) PER2::LUC bioluminescence in the inner nuclear layer of cultured vertical retinal slices showed a circadian variation with a peak at projected ZT 8–14. Shown are representative images acquired by 30-min exposures at 6-h intervals. Arrows point to membrane filters that became visible when signals in the inner nuclear layer were high. Scale bar represents 100 μm.
(C) Continuous recording of PER2::LUC bioluminescence in a representative cultured vertical retinal slice. In this experiment, retinal slices were prepared around ZT 4, incubated in CO2 incubator for 2 d, and then images (30-min exposure) were continuously collected for 47 h, starting at projected ZT 9.

