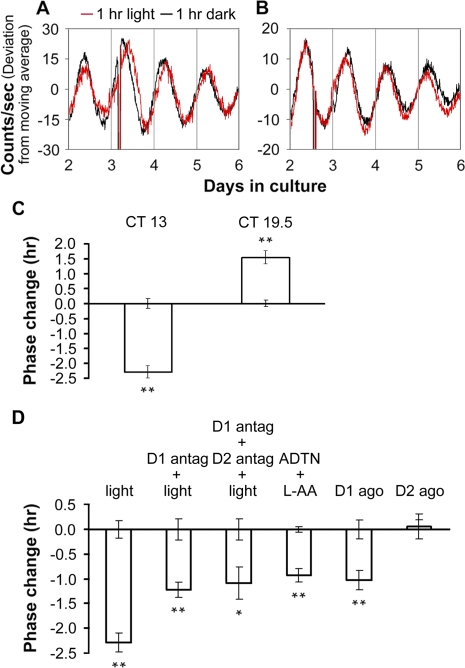
Figure 6. Light Resetting of the Phase of Retinal PER2::LUC Rhythms Is Mediated In Part through Dopamine D1 Receptors.
(A and B) Phase changes of retinal PER2::LUC rhythms induced by 1-h light pulses beginning at CT 13 (A) or CT 19.5 (B). Red traces show rhythms from explants that received light; black traces are from paired controls that were handled similarly, but did not receive light.
(C) Average data of light-induced phase shifts. Error bars from x-axis show ±SEM for controls in which retinal explant cultures were taken out from the LumiCycle and kept in darkness at 37 °C for 1 h.
(D) Phase changes of retinal PER2::LUC rhythms. Retinal explant cultures were subjected to or treated with: column 1, 1-h light pulses (a reproduction from [C]); column 2, pretreatment with the D1 receptor antagonist SCH-23390 (D1 antag; 50 μM) for 15 min followed by 1-h light pulses; column 3, pretreatment with SCH-23390 and the D2 antagonist sulpiride (D2 antag; 50 μM) together for 15 min followed by 1-h light pulses; column 4, the nonselective dopamine receptor agonist ADTN (100 μM; in vehicle containing 100 μM L-AA); column 5, the D1 agonist SKF 38393 (D1 ago; 50 μM); and column 6,the D2 agonist quinpirole (D2 ago; 50 μM). The 1-h light pulses or dopaminergic treatments were initiated at CT 13. Phase change was calculated as in Figure 5. A single asterisk (*) indicates p < 0.05; double asterisks (**) indicate p < 0.01; Student's t-test; n = at least 3 for each treatment and for controls.

