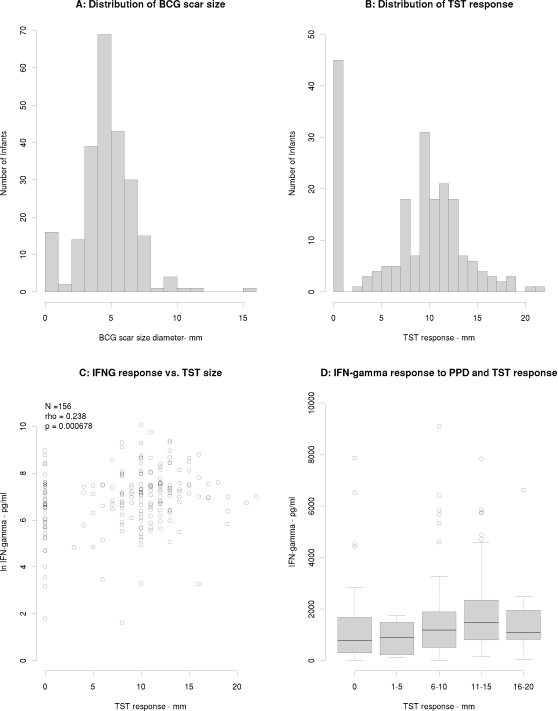
Figure 6.
A) Histogram showing distribution of BCG scar size in 236 infants measured at 2 months of age following BCG at birth. B) Histogram showing distribution of average TST size in 202 infants tested at 2 months of age following BCG at birth. C) Scatterplot showing correlation between interferon-γ and TST responses to PPD. D) Box and whisker plot showing median IFN-γ concentrations (pg/ml) in supernatant following stimulation with PPD in infants grouped according the size of TST response. IFN-γ: interferon-gamma; PPD: purified protein derivative; TST: tuberculin skin test.

