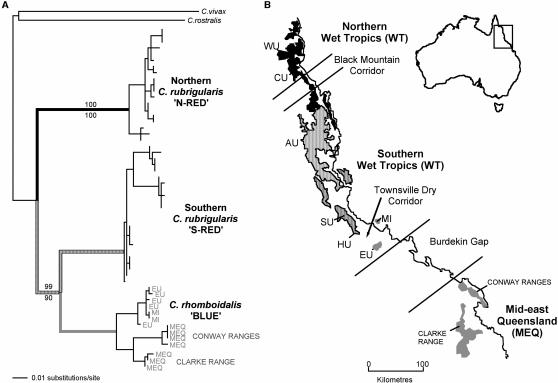
Figure 1. Phylogenetic relationships and spatial distributions of the three lineages of rainbow skinks.
A) Phylogenetic relationships among N-RED, S-RED and BLUE according to mitochondrial gene (ND4) maximum likelihood tree [20]. B) The map shows the extent of Wet Tropics and Mid-east Queensland rainforest, and the biogeographical distribution of each of the three Carlia lineages. The shades of lineages on the phylogeny correlate with shades of biogeographic distributions in the map of north-eastern Australia: N-RED in black, S-RED in hashed and BLUE in grey. For female preference trials, three populations from each lineage were collected: N-RED from Windsor Uplands (WU), Carbine Uplands (CU) northern Lamb Uplands (LU); S-RED from northern and southern Atherton Uplands (AU), Spec Uplands (SU); and BLUE from Mt. Elliot (EU), and Finch Hatton in the Clarke Ranges and Brandy Creek in the Conway Ranges in mid-east Queensland (MEQ). Refer to supplementary online material for specific location details. For population demographic analyses, individuals of S-RED were from Spec Uplands (SU) and Halifax Uplands (HU), and BLUE were from Mt. Elliot (EU), and Magnetic Island (MI).

