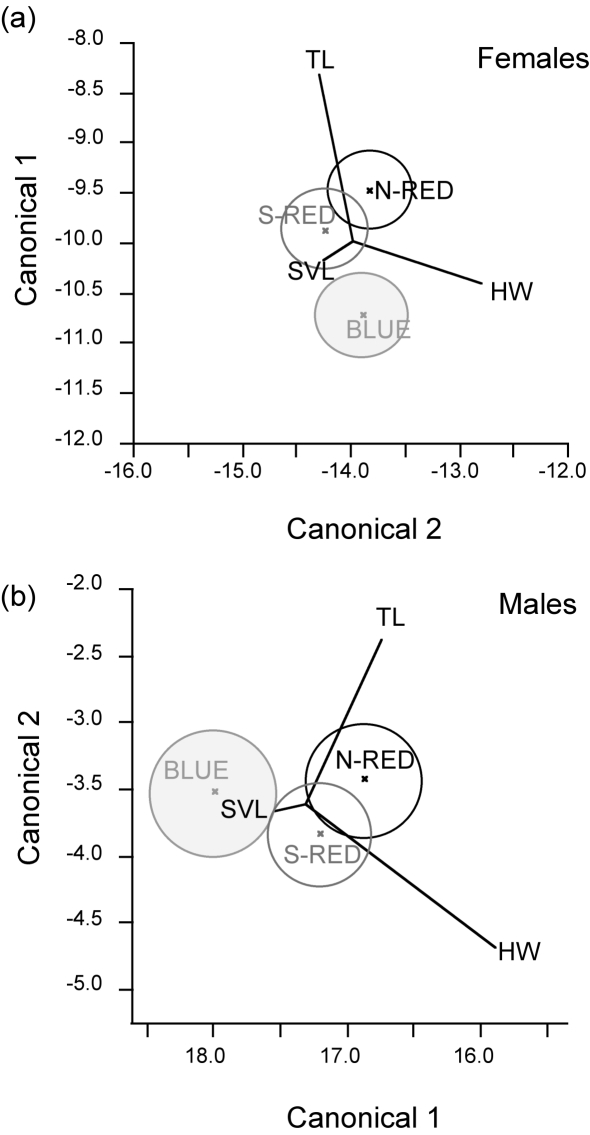
Figure 3. Morphological differentiation between N-RED, S-RED and BLUE.
Canonical centroid plots from discriminant analyses for a) females; and b) males. All parameter variables: log snout vent length (SVL), head width (HW), hind limb tibia length (TL) are represented as vectors, with the length of each vector indicating its ability to separate the groups and its direction assists in the interpretation of these differences. Circles represent the 95% confidence intervals around the lineage's centroid.

