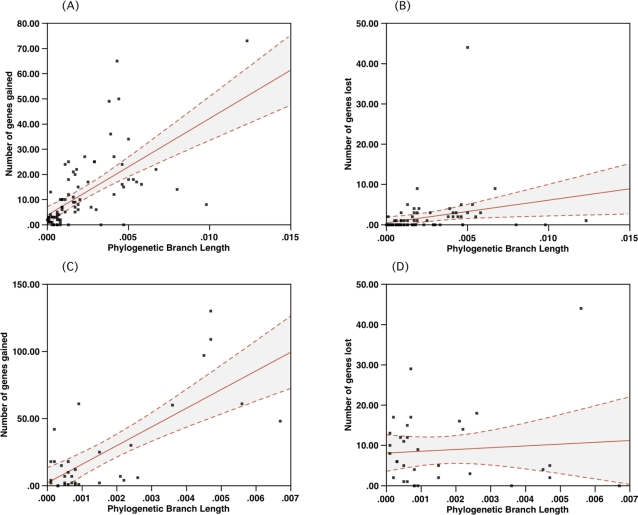
Figure 5. Gene accretion and loss in the baculovirus (5A and 5B) and poxvirus (5C and 5D).
Solid lines are least squares linear regression to the data. Dashed lines bound 95% confidence intervals on the mean regression lines. Rates of gene gain are far higher than rates of gene loss. The number of gain and loss events for baculovirus was estimated with MacClade and for poxvirus was obtained from McLysaght et al., [2]. The regression indicate a positive dependence on the number of gene gains on branch length in the tree for the complete genomes, whereas loss events were less frequent and had no significant dependence on branch length (as indicated by the low correlation coefficients on the shallow gradients). The data suggested that the process of gene gain in these 2 viral families is temporally organized, since genetic distance (branch lengths) is proportional to time. For both loss and gain the distribution of gain and loss departs from a simple exponential model predicted by the branch lengths. A similar accretion process of auxiliary gene functions in large DNA viruses has been observed for herpesvirus [1].

