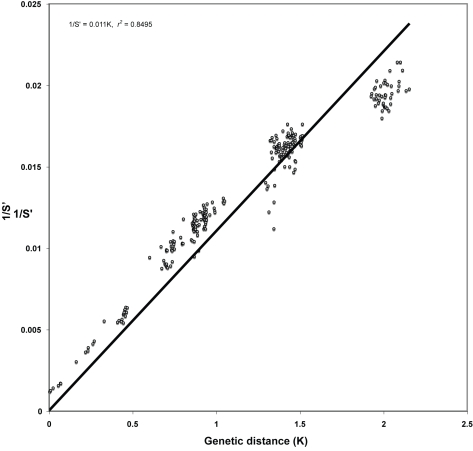
Figure 7. Plot of phenetic distance (1/S′) versus genetic distance (K) for baculoviruses.
K was estimated from a protein concatamer of the 29 genes conserved in 24 complete baculovirus genomes (excluding the CuniNPV). K was obtained using phylogenetic ML reconstruction. 1/S′ was estimated using BlastPhen. 85% of the data was explained by the regression supporting the use of 1/S′ as a practical measure of genetic diversity. The measure is however unable to correct for superposition as K increases above 1.5. Given k≅φ/S′, φ was estimated to average 82.91 for these data.

