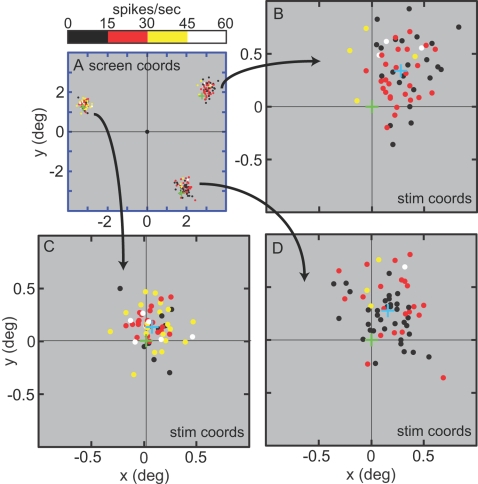
Figure 5. Saccade endpoint scatter for example cell in the 3-position task.
Each dot represents the endpoint for a single trial, and dot color indicates firing rate for that trial. A. Global view showing endpoints for all three stimulus locations. Green cross indicates stimulus center at each location. Coordinates are relative to central fixation point. B,C,D. Magnified views of individual stimulus locations. Green cross indicates stimulus center, and blue cross indicates average saccade landing point. Coordinates are relative to stimulus center.

