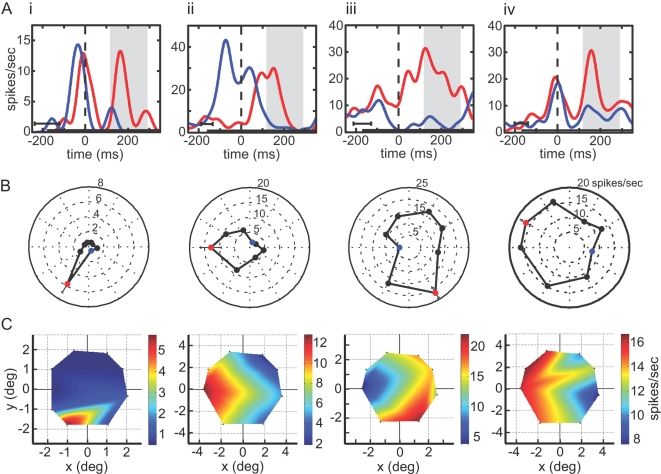
Figure 7. Four example cells showing eye position effects during 8-position task.
A. Time course of responses at best (red) and worst (blue) eye positions. Gray period indicates target fixation period shifted by neural latency. Curves smoothed using a 20 ms Gaussian kernel. B. Polar plots showing eye position effect. Radial dimension indicates firing rate, and angle dimension represents polar angle of stimulus position. Blue and red dots indicate positions producing lowest and highest responses. C. Interpolated response surface, showing firing rate as a function of eye position. Surface was generated by cubic spline interpolation through the eight data points (vertices of colored region).

