Figure 5.
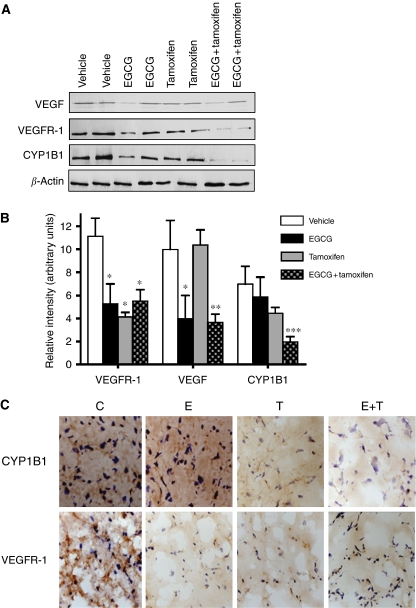
Tumour protein expression levels of VEGF, VEGFR-1, and CYP1B1 after treatment with EGCG and tamoxifen. Mice were treated with vehicle (5 ml kg−1), EGCG (25 mg kg−1, i.p.), tamoxifen (75 μg kg−1, p.o.), or EGCG+tamoxifen for 70 days. (A) Representative western blots of the various proteins from each individual mouse. (B) The results of scanning densitometry of western blots. For clarity, densitometry is shown only for proteins that were modulated by drug treatment. Bars represent the mean±s.e.m. from 10 mice per group. (C) Representative immunohistochemistry of CYP1B1 and VEGFR-1 from tumour sections of treated mice. *Significantly different from vehicle control (P<0.05). **Significantly different from vehicle and tamoxifen (P<0.01). ***Significantly different from all other treatments (P<0001).

