Figure 1.
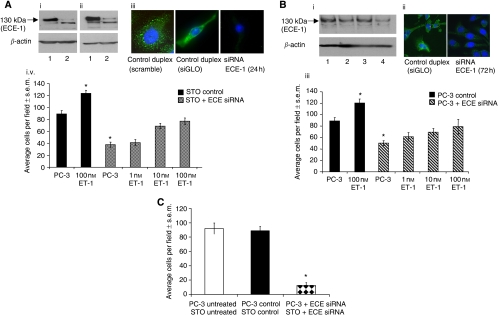
(A) Influence of ECE-1 siRNA expressed in stromal cells. STO cells were transfected with 100 nM ECE-1 siRNA oligonucleotides targeted to ECE-1 (either custom-made duplexes or a pool containing four different target sequences to eliminate the possibility of off-target effects) or oligonucleotides with a non-coding sequence (siGLO or scrambled sequence) using oligofectamine and incubated for 24 h. Samples were analysed using (i) western blotting: lane 1, siGLO-treated STO cells; lane 2, custom-made siRNA duplex to ECE-1; (ii) lane 1, siGLO-treated STO cells; lane 2, siRNA ECE-1 pool or (iii) immunofluorescence analysis. The polyclonal antibody to ECE-1 was used for the western blot analysis (1 : 500) and immunofluorescence (1 : 100). Anti-β-actin (1 : 10,000) was used as a loading control for western blotting. (iv) Invasion of PC-3 cells was measured in the presence of the ECE-1 siRNA-treated STO cells using a matrigel invasion assay. Endothelin-converting enzyme 1 siRNA STO cells were harvested 24 h post-transfection and added to the lower well of the invasion chamber. Endothelin-1- at 1–100 nM was added to both the STO (lower well) and the PC-3 (upper well), and the assay was incubated for 24 h. Each bar represents the mean value of eight fields counted; *P<0.001. (B) Influence of ECE-1 siRNA expressed in epithelial cells. The PC-3 cells were transfected with 100 nM ECE-1 siRNA using oligofectamine and incubated 24–72 h. siGLO siRNA was used as a negative control. Samples were analysed using (i) western blotting: lane 1, siGLO-treated STO cells; lanes 2–4, siRNA ECE-1 24–72 h or (ii) immunofluorescence analysis. The monoclonal antibody to ECE-1 was used for western blot analysis (1 : 200) and immunofluorescence (1 : 50). Anti-β-actin (1 : 10 000) was used as a loading control for western blotting. (iii) Invasion of ECE-1 siRNA PC-3 cells was measured in the presence of the STO cells using a matrigel invasion assay. Endothelin--1 at 1–100 nM was added to both the STO (lower well) and the PC-3 (upper well), and the assay was incubated for 24 h. Each bar represents the mean value of eight fields counted; *P<0.001. (C) Influence of ECE-1 siRNA expressed in both stromal and epithelial cells. Both the PC-3 cells and the STO cells were treated with siRNA ECE-1 and added to a matrigel invasion assay. Each bar represents the mean value of eight fields counted; *P<0.001.

