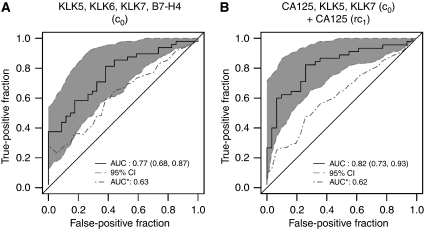
Figure 1.
ROC curves for chemotherapy response using marker panels. ROC curves for the ‘combined’ marker, without (‘original’, solid line) and with correction for overfitting (‘corrected’, dashed line). The correction for overfitting was done by the cross-validation procedure described under Materials and methods. (A) Combination using only baseline values (c0) of KLK5, KLK6, KLK7 and B7-H4. (B) Combination using baseline values (c0) of CA125, KLK5 and KLK7 and relative changes (rc1=log (c0/c1)) of CA125 from baseline to the first chemotherapy. Data for good vs poor response are further described in Table 1 and the combined model is described in Supplementary Table 4.

