Abstract
Purpose
To objectively characterize different heart tissues from functional and viability images provided by composite-strain-encoding (C-SENC) MRI.
Materials and Methods
C-SENC is a new MRI technique for simultaneously acquiring cardiac functional and viability images. In this work, an unsupervised multi-stage fuzzy clustering method is proposed to identify different heart tissues in the C-SENC images. The method is based on sequential application of the fuzzy c-means (FCM) and iterative self-organizing data (ISODATA) clustering algorithms. The proposed method is tested on simulated heart images and on images from nine patients with and without myocardial infarction (MI). The resulting clustered images are compared to MRI delayed-enhancement (DE) viability images for determining MI. Also, Bland-Altman analysis is conducted between the two methods.
Results
Normal myocardium, infarcted myocardium, and blood are correctly identified using the proposed method. The clustered images correctly identified 90 ± 4% of the pixels defined as infarct in the DE images. In addition, 89 ± 5% of the pixels defined as infarct in the clustered images were also defined as infarct in DE images. The Bland-Altman results show no bias between the two methods in identifying MI.
Conclusion
The proposed technique allows for objectively identifying divergent heart tissues, which would be potentially important for clinical decision-making in patients with MI.
Keywords: fuzzy clustering, FCM, ISODATA, C-SENC, MRI, heart, strain, viability
INTRODUCTION
The accurate characterization of myocardial function and viability following myocardial infarction (MI) is important for therapeutical decision-making. Cardiac functional images provide useful information about the contractility patterns in the affected regions (1-5). In contrast, the viability images can be used to differentiate viable and non-viable tissues (6-10). By combining the functional and viability information, three different myocardial tissue types can be identified: 1) normally contracting tissue, which represents normal myocardium; 2) non-contracting and non-viable tissue, which represents infarcted myocardium; and 3) non-contracting yet viable tissue, which could represent “stunned” or “hibernating” myocardium. Notably, the function of hibernating myocardium may improve after revascularization whereas that of infarcted myocardium does not (11). Stunned myocardium shows normal perfusion, thus revascularization is not needed in this territory.
Recently, the composite strain-encoding (C-SENC) MRI technique has been introduced for simultaneous cardiac functional and viability imaging in a single short breathhold (12). No additional time, when compared to standard delayed-enhancement (DE) viability imaging, is required for acquiring the additional functional images. The technique results in three images: no-tuning (NT), low-tuning (LT), and high-tuning (HT). Bright regions in the NT, LT, and HT images represent infarction (or blood), akinetic, and contracting tissues, respectively. An anatomy (ANAT) image of the heart can also be constructed by adding the LT and HT images as described in (3) to show the anatomical structure of the heart (both contracting and non-contracting myocardium) with no signal from blood. Thus, each pixel in the image can be represented by a 3-element vector in the NT-ANAT-HT 3-D space of signal intensities. Different tissue types occupy different regions in this 3-D space based on their characteristic signal intensities in the three images, as shown in table 1.
Table 1.
Signal intensities of different tissues in the No-Tuning (NT), Anatomy (ANAT), and High-Tuning (HT) C-SENC images. High = signal intensities greater than 0.8 in normalized images; and Low = signal intensities less than 0.2 in normalized images.
| Tissue | NT Image | ANAT Image | HT Image |
|---|---|---|---|
| Blood | High | Low | Low |
| Infarcted myocardium | High | High | Low |
| Non-infarcted myocardium | Medium | High | Continuum |
| Background noise | Low | Low | Low |
In this paper, an unsupervised, multi-stage fuzzy clustering technique is proposed to extract different clusters in the NT-ANAT-HT space, and thereby characterize different myocardial tissues. It should be noted that several clustering techniques have been introduced in the literature to identify different tissue types from MRI images of different body parts (13-15). Unsupervised clustering techniques are particularly attractive because they require little or no human interaction, thus allowing for more objective analysis. Especially, fuzzy clustering techniques have successfully been implemented in many applications (16-18). Fuzzy clustering is adopted in this work because it allows for partial membership, whereby each pixel can belong to more than one cluster with different degrees of membership. This feature is suitable for medical MRI image analysis because it takes boundary tissues and partial volume effects into consideration. The proposed technique consists of three sequential stages. In the first stage, the fuzzy c-means (FCM) algorithm (19,20) is implemented to segment the dataset (the pixels in a region-of-interest (ROI) around the heart) into three main clusters: blood, myocardium (contracting and non-contracting), and background. In the second stage, the iterative self-organizing data (ISODATA) technique (13) segments the myocardium cluster into infarcted and non-infarcted tissues. Finally, a certain degree of strain is assigned to each pixel in the non-infarcted tissue cluster (3).
MATERIALS AND METHODS
C-SENC Imaging
C-SENC MRI is a modification of the strain-encoding (SENC) technique (3), which allows for simultaneous functional and viability imaging of the heart. Figure 1 shows a simplified diagram of the C-SENC pulse sequence. The C-SENC technique is described in details in (12). Briefly, the sequence consists of two parts: tagging and imaging. During the tagging part, the magnetization is modulated in the through-plane (z) direction with certain tagging frequency. During the time delay (TD) after tagging, the tagging frequency increases or decreases according to the through-plane tissue contraction or stretching, respectively (21). Furthermore, longitudinal magnetization experiences relaxation with different rates for normal and infarcted myocardium after administration of the gadolinium (Gd)-diethylene triamine pentaacetic acid (DTPA) contrast agent. At the imaging timepoint, three images (NT, LT, and HT) are consecutively acquired with different frequency tunings. Functional and viability images are constructed from the three images as previously described (12).
FIGURE 1.
Pulse sequence diagram. The first portion of the pulse sequence is tagging, where the magnetization is modulated in the z-direction right after the detection of the R-wave of the electrocardiogram (ECG). Later at the imaging timepoint, three images are consecutively acquired (18 ms apart) with three radiofrequency (RF) pulses (αNT, αLT, and αHT) and three demodulation gradients (NT, LT, and HT) in the z-direction. Spiral acquisition is used for signal readout. The magnetization then recovers until the next cardiac cycle. NT = no-tuning; LT = low-tuning; HT = high-tuning; and TR = repetition time.
Simulated C-SENC Images
Simulated C-SENC MR images were created in MATLAB (The MathWorks, Inc., Natick, MA) to test the proposed clustering technique. The simulated images were designed to represent short-axis (SAX) or four-chamber (4-CH) heart slices with infarcts of different sizes. Different levels of white Gaussian noise, with standard deviation up to 10%, were added to the images. The 3-stage clustering technique was tested on the simulated images.
Patient Experiments
Nine patients (seven with MI by DE MRI) were scanned in the supine position on a 3T MRI scanner (Philips Medical Systems, Best, The Netherlands) with a 6-element phased-array cardiac receiver coil to acquire SAX or 4-CH C-SENC images. For some patients, multi-slice images were acquired to cover large infarcts. The protocol was approved by the Institutional Review Board of our institution and written informed consent was obtained from all participants after full explanation of the procedure. Standard steady-state free precession (SSFP) images were firstly acquired for plane scouting before C-SENC imaging. The experimental parameters for the C-SENC images were as follows: spiral acquisition (for efficient readout) with 12 spirals × 12 ms acquisition window; TR/TE = 18/2.6 ms; heart rate = 60-90 beat per minute (bpm); breathhold ≈9s (depending on heart rate); time-delay (TD) between the R-wave and the imaging part ≈300 ms; slice thickness = 10 mm; FOV = 350×350 mm2; scan matrix =176×176; and flip angles = 27°, 32°, and 40° for αNT, αLT, and αHT, respectively (shown in Fig. 1). The images were acquired 10-15 minutes after a 0.2 mmol/kg intravenous injection of Gd-DTPA (Magnevist, Berlex laboratories, Wayne, NJ, USA). Tagging preparation was applied at the beginning of each R-R interval.
In addition to the C-SENC images, inversion recovery (IR) DE MRI viability images were acquired at the same anatomical levels (geometrical planes) and orientations as those of the C-SENC images to alleviate misregistration problems when comparing the two images. Furthermore, since the size of the delayed-hyperenhancement region could be different based on the imaging time after contrast agent administration, DE and C-SENC imaging were performed in random order immediately after each other, typically at 10-15 minutes after Gd-DTPA injection. The DE images were acquired with similar imaging parameters to the C-SENC images, and the inversion time (TI) was visually selected from a low-resolution scan with incremental values of TI in order to achieve good myocardium-infarct contrast in the DE images.
The total scan times, including short patient recovery and breathhold instruction, ranged from 19 to 29 seconds for C-SENC imaging and from 17 to 27 seconds for DE imaging. Because the C-SENC and DE images are acquired immediately after each other, the maximum time separation between the two acquisitions is less than 30 seconds, which is negligible compared to the washout time of the contrast agent.
Clustering Technique
Each pixel is represented by a three-dimensional (3D) vector in the NT-ANAT-HT normalized intensity space. This intensity vector is the input to the clustering technique, which assigns to each pixel some degree of membership—between zero and one—to the different clusters: blood, infarcted tissue, non-infarcted tissue, and background, and such that the sum of the membership values equals one. Besides, each pixel in the non-infarcted tissue cluster is assigned certain grade—between zero and one—based on strain.
Figure 2 shows a schematic diagram of the proposed fuzzy clustering technique, which consists of three stages that were implemented in MATLAB. In the first stage, the FCM algorithm (19,20,22), described in the appendix, is applied to divide the dataset into three major clusters: blood, myocardium (contracting and non-contracting), and background, which are colored in red, green, and black, respectively. The FCM algorithm is based on minimizing a weighted cost function by iteratively updating the cluster centers and membership values (19). It should be noted that no cluster was specifically added to represent infarcted myocardium. The reason is that at this point it is not known whether an infarct exists or not. Besides, the infarct cluster usually has fewer datapoints than other clusters, thus it could be overlooked by the FCM algorithm if it was added at this stage. Because the quality of the FCM solution—like that of most nonlinear optimization problems—depends on the choice of the initial values, the cluster centers were automatically initialized to the expected locations of the corresponding clusters based on their intensity characteristics in the various C-SENC images.
FIGURE 2.
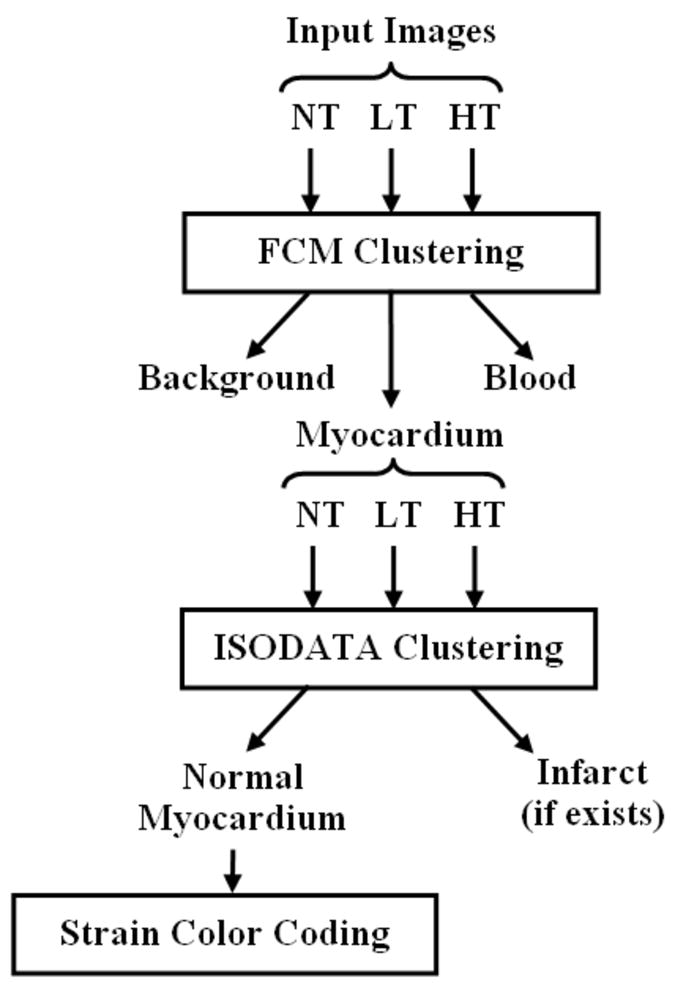
Schematic diagram of the clustering method. The method consists of three stages. In the first stage, the fuzzy c-means (FCM) algorithm clusters the image into three main clusters: blood, myocardium, and background. In the second stage, the iterative self-organizing data (ISODATA) algorithm further clusters the myocardium into non-infarcted and infarcted myocardium. Finally, each pixel in the cluster of non-infarcted myocardium is given certain grade of color based on strain.
The second stage of the proposed technique consists of further clustering the myocardium cluster into infarcted (blue) and non-infarcted (green) tissues through the application of the ISODATA technique (13), which is described in the appendix. During this stage, the substructure of the myocardium class is examined in more detail to investigate the existence of infarct cluster, which may contain few datapoints. The initial number of clusters was set to five. During each iteration of ISODATA, clusters with too few members are discarded; clusters with high variance are split into two clusters; and clusters that are too close are combined into one cluster (13). If the ISODATA algorithm ends in one cluster, then no infarct is assumed to exist. Alternatively, if more than one cluster exist after applying the algorithm, then there is a possibility of infarct existence. In this case, the cluster whose center has the largest NT intensity is compared to that of the blood cluster. It is considered infarct if the NT component of its center exceeds that of the blood center. Otherwise, it is assumed to be non-infracted tissue. This rule for identifying infarcted myocardium is based on the relation between the signal intensities of blood, infarcted myocardium, and non-infarcted myocardium in T1-weighted images after the administration of Gd-DTPA as described in (23).
The third stage of the proposed technique involves assigning different grades of green color to the non-infarcted myocardium based on the strain value calculated for each pixel. The strain map is computed from the LT and HT images as described in (3). Pure green and white represent maximum and minimum strains, respectively. Finally, the clustered heart image undergoes a morphological operation to impose spatial continuity. Isolated points of less than 2×2 pixels are considered noise and are replaced by the average value of the neighboring pixels. This process removes spurious noise points that exist in the middle of a certain tissue type.
Validation
The images were transferred to a personal computer, and image analysis was performed using custom-written algorithms in MATLAB. The infarcted regions were extracted from the DE images using the full-width at half-maximum (FWHM) technique as previously explained in (24). This method proved to give accurate and reproducible results when compared to postmortem results (24). The infarcts were extracted from the clustered images by extracting the pixels with membership value ≥ 0.5 to the infarct cluster. The infarcted regions extracted from the clustered images were compared to those extracted from the DE images on a pixel-by-pixel basis to determine the effectiveness of the proposed technique in identifying MI. In addition, a Bland-Altman analysis (25) from the correlation of the two methods was conducted to determine if there is a bias between the two methods in identifying the infarcted regions. It should be noted that the DE images are the gold standard MRI images used in this study for identifying infarcted myocardium, and they are not used to construct the clustered images. The clustered images are rather constructed from the three C-SENC images, which are obtained in a separate acquisition from the DE images.
RESULTS
Simulated C-SENC Images
Figure 3 shows simulated 4-CH C-SENC images and the resulting clustered image. The FCM objective function is also shown in the figure versus number of iterations. The clustered images correctly identified 91% of the pixels marked as infarct in the noise-free simulated images. In addition, 92% of the pixels defined as infarct in the clustered images were marked as infarct in the noise-free simulated images. Normal myocardium and blood were also correctly identified in the clustered images with ratios of 95% (89%) for normal myocardium and 92% (93%) for blood. Quantitative performance and visual comparisons demonstrate the robustness of the proposed technique for identifying different tissue types.
FIGURE 3.
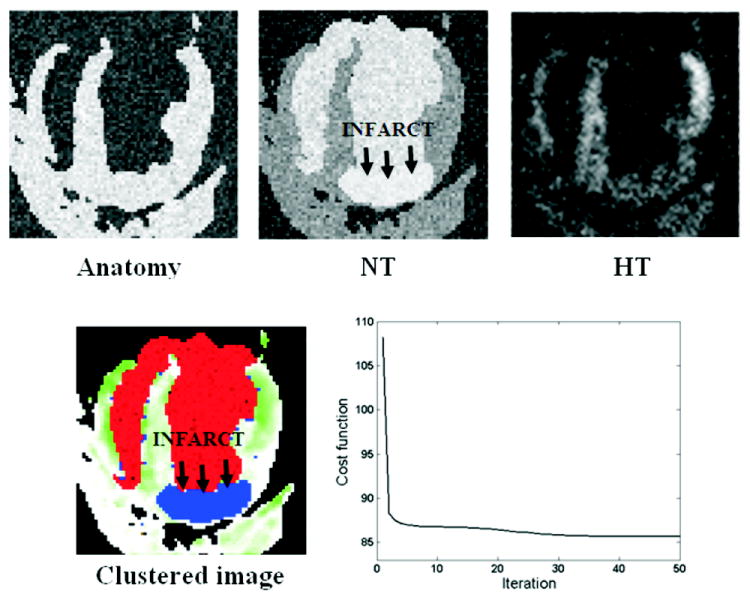
Simulated C-SENC MRI images and the resulting clustered image. Bright regions in the anatomy, NT, and HT images represent: tissue (contracting and non-contracting), infarct (or blood), and contracting myocardium, respectively. Red and blue in the clustered image represent blood and infarct, respectively. Non-infarcted myocardium is assigned different grades of green based on strain (green and white represent minimum and maximum strain, respectively). The FCM objective cost function is also shown in the figure.
Patient Results
Figure 4 shows the resulting C-SENC images of a patient with MI. The three images show the same anatomical slice imaged with different demodulation frequencies. The constructed ANAT image is shown as well. Bright regions in the NT, LT, and HT images represent infarct (or blood), static tissue, and contracting myocardium, respectively. It should be noted that the simulated ANAT image in Fig. 3 may look different from that in Fig. 4 because the actual C-SENC images in Fig. 4 have relatively lower spatial resolution. Also, the noise level added to the simulated images in Fig. 3 exceeds that of the patient images in Fig. 4.
FIGURE 4.

Representative C-SENC MRI images from a patient with myocardial infarction (arrows). Bright regions in the NT, LT, and HT images represent infarcted, akinetic, and contracting myocardium, respectively.
Figure 5 shows the NT-ANAT-HT intensity distribution after applying the proposed clustering technique to a ROI surrounding the heart in the C-SENC images in Fig. 4. The figure shows the resulting images after applying each stage of the clustering technique. After applying FCM, the heart image is segmented into blood (red), myocardium (green), and background (black). The ISODATA algorithm then segments the myocardium class into infarcted (blue) and non-infarcted (green) tissues. Finally, the non-infarcted tissue is assigned different grades of green based on strain, where green and white represent maximum (-25%) and minimum (0%) end-systolic strains, respectively, as shown on the strain map (the minus sign means contractility). One observation is that the clustered image shows a rim of non-contracting (white) subepicardial region next to the infarct (outer arrows on the clustered image). This region has a maximum of -4% strain, compared to -25% strain in the lateral wall. The figure also shows the corresponding DE and SSFP images. There is good agreement between the infarcts shown in the DE and clustered images. The endocardium and epicardium were manually traced on the SSFP images, which shows a significant decrease in myocardial thickening in the affected regions (arrows) compared to non-affected regions.
FIGURE 5.
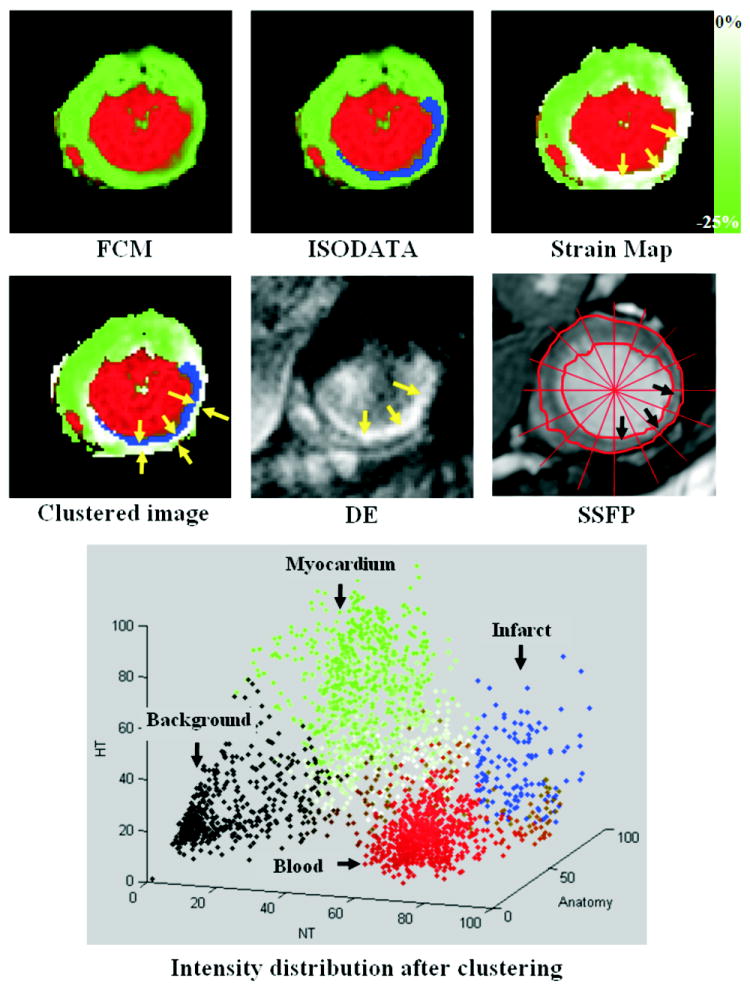
Results of clustering the images in figure 4 (small ROI around the heart is considered). The figure shows the results after applying each stage of the clustering algorithm, as well as the NT-HT-Anatomy intensity distribution of the clustered image (0 and 100 represent no signal and the maximum signal intensity, respectively). The FCM stage clusters the image into blood (red), myocardium (green), and background (black). The ISODATA stage then clusters the myocardium into infarcted (blue) and non-infarcted (green) tissues. Finally, the non-infarcted myocardium is given different grades of green based on strain (green = maximum strain, white = no strain). The arrows in the strain map point to the affected region with poor myocardial strain. The final clustered image is shown in the second row. The corresponding delayed-enhancement (DE) and SSFP images are also shown. The arrows point to the infarct (blue) and the adjacent non-contracting (and non-infarcted) myocardium (outer arrows in the final clustered image). There is a good agreement between the infarcted region in the clustered and DE images. The SSFP image shows a remarkable decrease in myocardial thickening at end-systole in the affected region (arrows) compared to the non-affected regions.
Figure 6 shows an example of a multi-slice infarct in a patient. Apical, mid-ventricular, and basal SAX clustered slices are shown in the figure, as well as the corresponding DE images. One observation is that the basal DE slice shows bright infarct and blood, which hinders correct identification of the infarcted region in this slice. However, this is not the case in the corresponding clustered image because of the black-blood property in the resulting SENC images. Figure 7 shows the resulting clustered images, and the corresponding DE images, from another patient with a small infarct.
FIGURE 6.
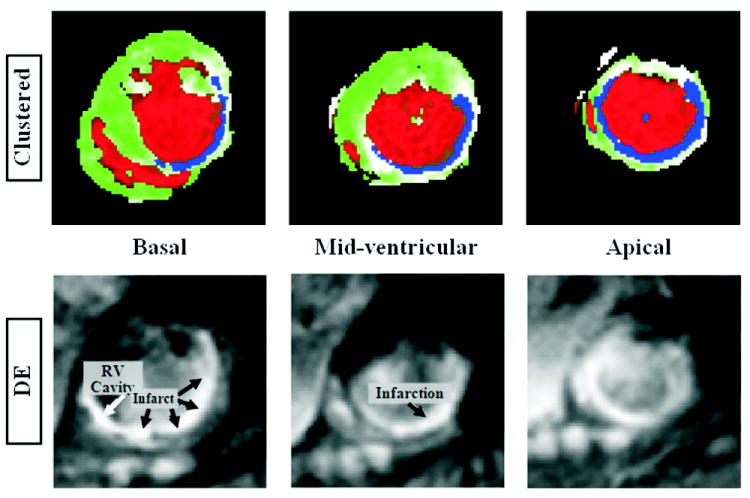
An example of a multi-slice infarct. Apical, mid-ventricular, and basal short-axis slices are shown. Top and bottom rows show the clustered and delayed-enhancement images, respectively. The basal DE slice shows bright infarct and blood, which hinders correct identification of the infarcted region. This is not the case in the corresponding clustered image because of the black-blood property in the resulting SENC images.
FIGURE 7.
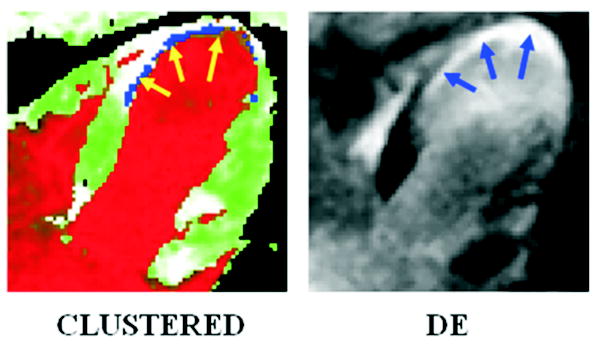
Results from a patient with a small infarct. The arrows point to the infarcted regions.
Because the FCM iteration starts close enough to the expected cluster centers, the ensuing sequence of iterations always converges to that particular minimum. The FCM and ISODATA stages take 15 and 20 iterations, respectively, on average. The average total processing time is less than 7 seconds on a personal computer.
Validation Results
The results from all analyzed slices (35 slices) show that the clustered images correctly identified 90 ± 4% of the pixels defined as infarct in the DE images. In addition, 89 ± 5% of the pixels defined as infarct in the clustered images were also defined as infarct in DE images. Fig. 8 shows the results from the Bland-Altman analysis. The mean difference between the infarcts sizes determined from the clustered and DE images was 0.05 ± 0.7 cm2 (mean ± 2 standard deviations) in the Bland-Altman analysis, which shows no bias between the two methods for identifying MI.
FIGURE 8.
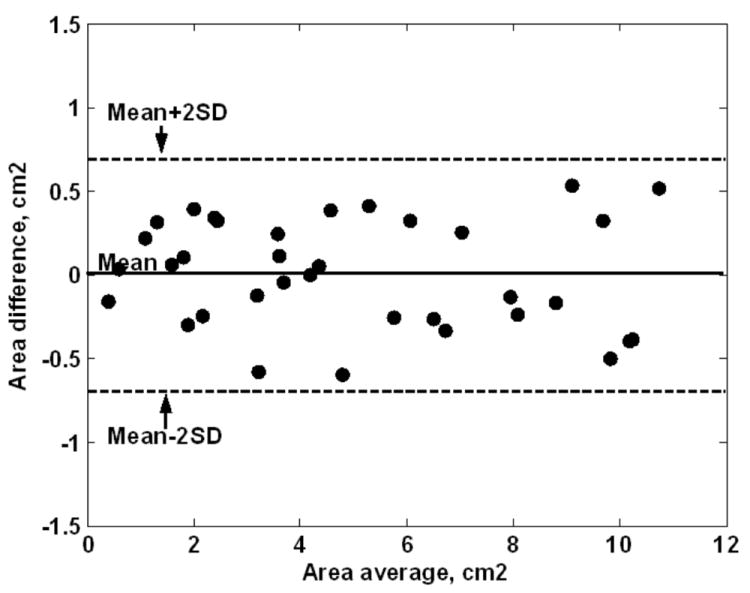
Bland-Altman results of the infarct sizes computed from the clustered and DE images. The results show no biasness between the two methods.
DISCUSSION
The proposed technique is found to be robust in determining the existence of infarction. Infarcted myocardium is specified only if there are enough datapoints in the infarct cluster during the application of the ISODATA technique. For all the analyzed images, the technique correctly determines infarction existence. It identifies the correct infarcted region as evidenced by the corresponding DE images.
One advantage of the resulting clustered images is the excellent identification of the blood cluster due to the black-blood property in the LT and HT images. This has the effect of better delineating the infarct endocardial border compared to the DE images, where the blood-infarct contrast is suboptimal. Thus, the resulting clustered images would allow for accurate measurement of the infarct size.
One observation is that the clustered images show rims of non-contracting (white) subepicardial regions next to the infarcts, as shown in Fig. 5. The interesting point about these regions is that they are viable (no blue color) because they do not give hyperenhanced signal in the corresponding NT or DE image. However, these regions are not functioning properly (no green color). Such regions are of considerable importance as they may represent hibernating myocardium whose functional recovery depends on performing a revascularization operation (11). Thus, the viability and functional information about these regions may be key factors in diagnosis and therapeutical decision-making.
It should be noted that although the FCM and ISODATA techniques are important clustering techniques by themselves, their combination is more suitable for the current application. One disadvantage of the FCM technique is that the number of clusters have to be known a priori, which is not suitable because in the current application, the clustering method is meant to determine the existence of infarction and return the correct number of clusters. Thus, the FCM algorithm is used only during the first stage of the proposed method when it is certain that every image contains exactly three clusters: blood, myocardium, and background. The next stage of the proposed technique is to fine-tune the clustering by examining in more detail the sub-structure of the myocardium class with the possibility of infarct existence. In this stage, the ISODATA technique is suitable for this job, because it determines the number of clusters based on cluster splitting and merging operations.
Finally, future work may be conducted to improve the proposed technique. One approach is to examine the case when the noise level is different among the C-SENC images, which would necessitate considering this topology structure in the clustering method. Another point to be considered is the processing speed of the clustering algorithm. Although the current MATLAB version of the algorithm needs less than 7 seconds on a personal computer, we anticipate that the translation of the code to a lower-level language, like C++, with code optimization, would allow for real-time results on the workstation unit next to the MRI scanner. Future work would also include scanning infarcted animal models and conducting histopathological studies to verify the interpretation of the NT, LT, and HT images compared to the gold standard histopathological results. It should be also noted that the spatial resolution of the C-SENC images is suboptimal to that of the DE images, mainly due to breathhold limitation. However, techniques for improving spatial resolution, e.g. using navigator-echo free breathing or parallel imaging techniques, have to be combined with C-SENC imaging, which is critical for future clinical applications. Finally, the C-SENC images suffer from signal-to-noise (SNR) loss compared to non-modulated sequences. However, imaging at 3T, in combination with fast signal readout, would compensate for this relative signal loss.
In conclusion, a new fuzzy clustering technique is proposed for identifying different heart tissues from C-SENC functional and viability images. The technique is based on the consecutive application of the FCM and ISODATA techniques. The technique is successfully applied to SAX and 4-CH images of the heart as well as to simulated C-SENC images. The resulting images show good agreement with the standard DE MRI viability images in determining the infarcted regions. The combination of the functional and viability information in the resulting clustered images would allow for better analysis of the heart condition, which would help for better decision-making in patients with MI.
Acknowledgments
Grant Support: This work was supported by a grant from the Donald W. Reynolds Foundation as well as NIH grant HL61912.
APPENDIX
FCM Algorithm
Step 0: Set c (number of clusters) = 3; n = # pixels in the image; m (exponent value) = 2; ε (cost function improvement threshold) = 0.00001; cblood (blood cluster center) [NT ANAT HT] = [0.8 0.2 0.2]; ctissue = [0.5 0.8 0.5]; cbkg = [0.2 0.2 0.2] (normalized signal intensity).
-
Step 1: Initialize the membership matrix U by assigning each datapoint (pixel), x, to the closest cluster using the minimum Euclidean distance, dij, between datapoint xi and cluster centers cj. The membership values should satisfy the constraints:
Step 2: Calculate cluster centers:
-
Step 3: Compute the cost function:
Stop if improvement over previous iteration is below threshold ε.
Step 4: Compute a new membership matrix:
Step 5: Go to step 2.
ISODATA Algorithm
- Step 0: Set the following parameters:
- ND (estimated number of desired clusters) = 2;
- NC (initial number of clusters) = 5;
- T (minimum number of datapoints in a cluster) = 25;
- σs (maximum standard deviation (sd) allowed for a cluster) = sd of blood;
- dm (minimum distance allowed between two cluster centers) = 0.2 (normalized intensity);
- Nmax (maximum number of clusters that can be merged in one iteration) = 2;
- Iterationmax (maximum number of iteration) = 50.
Step 1: Randomly initialize the cluster centers.
Step 2: Distribute datapoints among the clusters using the Euclidean distance measure.
Step 3: Discard clusters with fewer than T datapoints. Members of these clusters are assigned to other clusters based on minimum Euclidean distance. Decrease NC accordingly.
Step 4: Compute new cluster centers.
- Step 5: If NC < ND/2, go to step 6.
- On even iterations, or if NC > 2ND, go to step 8
- Otherwise, go to step 6.
Step 6: Compute the standard deviation (sd) of each cluster, σi.
Step 7: Cluster splitting: If for any cluster i, the sd σi is greater than σs, and NC < 2ND, then split the cluster into two clusters whose centers differ only in the coordinate with the maximum variance. Re-assign the datapoints of the original cluster to the two new clusters based on minimum distance. Increase NC by one.
Step 8: Compute the pairwise distance between all clusters, dij
Step 9: Cluster merging: For each dij < dm: if clusters i and j have not been used in merging in this iteration, then merge clusters i and j into one cluster. Compute the new cluster center and decrement NC by one.
Step 10: Repeat until clustering of datapoints stays within some threshold between iterations or until Iterationmax is reached.
Footnotes
Conflict of Interests: Dr. Stuber is compensated as a consultant by Philips Medical Systems NL, the manufacturer of equipment described in this presentation. The terms of this arrangement have been approved by the Johns Hopkins University in accordance with its conflict of interest policies. Dr. Nael F. Osman is a founder and share holder in Diagnosoft, Inc. The terms of this arrangement have been approved by the Johns Hopkins University in accordance with its conflict of interest policies.
References
- 1.Axel L, Dougherty L. MR imaging of motion with spatial modulation of magnetization. Radiology. 1989;171:841–845. doi: 10.1148/radiology.171.3.2717762. [DOI] [PubMed] [Google Scholar]
- 2.Fischer SE, McKinnon GC, Maier SE, Boesiger P. Improved Myocardial tagging contrast. Magn Reson Med. 1993;30:191–200. doi: 10.1002/mrm.1910300207. [DOI] [PubMed] [Google Scholar]
- 3.Osman NF, Sampath S, Atalar E, Prince JL. Imaging longitudinal cardiac strain on short-axis images using strain-encoding MRI. Magn Reson Med. 2001;46:324–334. doi: 10.1002/mrm.1195. [DOI] [PubMed] [Google Scholar]
- 4.Aletras A, Ding S, Balaban RS, Wen H. DENSE: displacement encoding with stimulated echoes in cardiac functional MRI. J Magn Reson. 1999;137:247–252. doi: 10.1006/jmre.1998.1676. [DOI] [PMC free article] [PubMed] [Google Scholar]
- 5.Gilson WD, Yang Z, French BA, Epstein FH. Complementary displacement-encoded MRI for contrast-enhanced infarct detection and quantification of myocardial function in mice. Magn Reson Med. 2004;51:744–752. doi: 10.1002/mrm.20003. [DOI] [PubMed] [Google Scholar]
- 6.Kim RJ, Fieno DS, Parrish TB, et al. Relationship of MRI delayed contrast enhancement to irreversible injury, infarct age, and contractile function. Circulation. 1999;100:1992–2002. doi: 10.1161/01.cir.100.19.1992. [DOI] [PubMed] [Google Scholar]
- 7.Wu KC, Lima JA. Noninvasive imaging of myocardial viability: current techniques and future developments. Circ Res. 2003;93:1146–1158. doi: 10.1161/01.RES.0000103863.40055.E8. [DOI] [PubMed] [Google Scholar]
- 8.Choi KM, Kim RJ, Gubernikoff G, Vargas JD, Parker M, Judd RM. Transmural extent of acute myocardial infarction predicts long-term improvement in contractile function. Circulation. 2001;104:1101–1107. doi: 10.1161/hc3501.096798. [DOI] [PubMed] [Google Scholar]
- 9.Oshiniki JN, Yang Z, Jones JR, Mata JF, French BA. Imaging time after Gd-DTPA injection is critical in using delayed enhancement to determine infarct size accurately with magnetic resonance imaging. Circulation. 2001;104:2838–2842. doi: 10.1161/hc4801.100351. [DOI] [PubMed] [Google Scholar]
- 10.Kim RJ, Wu E, Rafael A, et al. The use of contrast-enhanced magnetic resonance imaging to identify reversible myocardial dysfunction. N Engl J Med. 2000;343:1445–1453. doi: 10.1056/NEJM200011163432003. [DOI] [PubMed] [Google Scholar]
- 11.Watzinger N, Saeed M, Wendland MF, Akbari H, Lund G, Higgins CB. Myocardial viability: magnetic resonance assessment of functional reserve and tissue characterization. J Cardiovasc Magn Reson. 2001;3:195–208. doi: 10.1081/jcmr-100107468. [DOI] [PubMed] [Google Scholar]
- 12.Ibrahim EH, Stuber M, Kraitchman DL, Weiss RG, Osman NF. Combined functional and viability cardiac MR imaging in a single breathhold. Magn Reson Med. 2007;58:843–849. doi: 10.1002/mrm.21390. [DOI] [PubMed] [Google Scholar]
- 13.Jacobs MA, Knight RA, Soltanian-Zadeh H, et al. Unsupervised segmentation of multiparameter MRI in experimental cerebral ischemia with comparison to T2, diffusion, and ADC MRI parameters and histopahological validation. J Magn Reson Imaging. 2000;11:425–437. doi: 10.1002/(sici)1522-2586(200004)11:4<425::aid-jmri11>3.0.co;2-0. [DOI] [PubMed] [Google Scholar]
- 14.Taxt T, Lundervold A, Fuglaas B, Lien H, Abeler V. Multispectral analysis of uterine corpus tumors in magnetic resonance imaging. Magn Reson Med. 1992;23:55–76. doi: 10.1002/mrm.1910230108. [DOI] [PubMed] [Google Scholar]
- 15.Itskovich VV, Samber DD, Mani V, et al. Quantification of human atherosclerotic plaques using spatially enhanced cluster analysis of multicontrast-weighted magnetic resonance images. Magn Reson Med. 2004;52:515–523. doi: 10.1002/mrm.20154. [DOI] [PubMed] [Google Scholar]
- 16.Bensaid AM, Hall LO, Bezdek JC, et al. Validity-guided (re)clustering with applications to image segmentation. IEEE Trans Fuzzy Syst. 1996;4:112–123. [Google Scholar]
- 17.Chiu SL. Fuzzy model identification based on cluster estimation. J Intell Fuzzy syst. 1994;2:267–278. [Google Scholar]
- 18.Pal NR, Pal K, Keller JM, Bezdek JC. A possibilistic fuzzy c-means clustering algorithm. IEEE Trans Fuzzy Syst. 2005;13:517–530. [Google Scholar]
- 19.Bezdek JC. Pattern recognition with fuzzy objective function algorithms. New York: Plenum Press; 1981. [Google Scholar]
- 20.Hathaway RJ, Bezdek JC. Recent convergence results for the fuzzy c-means clustering algorithms. J Classif. 1988;5:237–247. [Google Scholar]
- 21.Fischer SE, Stuber M, Scheidegger MB, Boesiger P. Limitations of stimulated echo acquisition mode (STEAM) techniques in cardiac applications. Magn Reson Med. 1995;34:80–91. doi: 10.1002/mrm.1910340113. [DOI] [PubMed] [Google Scholar]
- 22.Bezdek JC, Hathaway RJ, Sabin MJ, Tucker WT. Convergence theory for fuzzy c-means:counterexamples and repairs. IEEE Trans Syst Man Cybern. 1987;17:873–877. [Google Scholar]
- 23.Wendland MF, Saeed M, Lauerma K, et al. Alterations in T1 of normal and reperfused infarcted myocardium after Gd-BOPTA versus GD-DTPA on inversion recovery EPI. Magn Reson Med. 1997;37:448–456. doi: 10.1002/mrm.1910370324. [DOI] [PMC free article] [PubMed] [Google Scholar]
- 24.Amado LC, Gerber BL, Gupta SN, et al. Accurate and objective infarct sizing by contrast-enhanced magnetic resonance imaging in a canine myocardial infarction model. J Am Coll Cardiol. 2004;44:2383–2389. doi: 10.1016/j.jacc.2004.09.020. [DOI] [PubMed] [Google Scholar]
- 25.Altman DG, Bland JM. Measurement in medicine: the analysis of method comparison studies. The Statistician. 1983;32:307–317. [Google Scholar]


