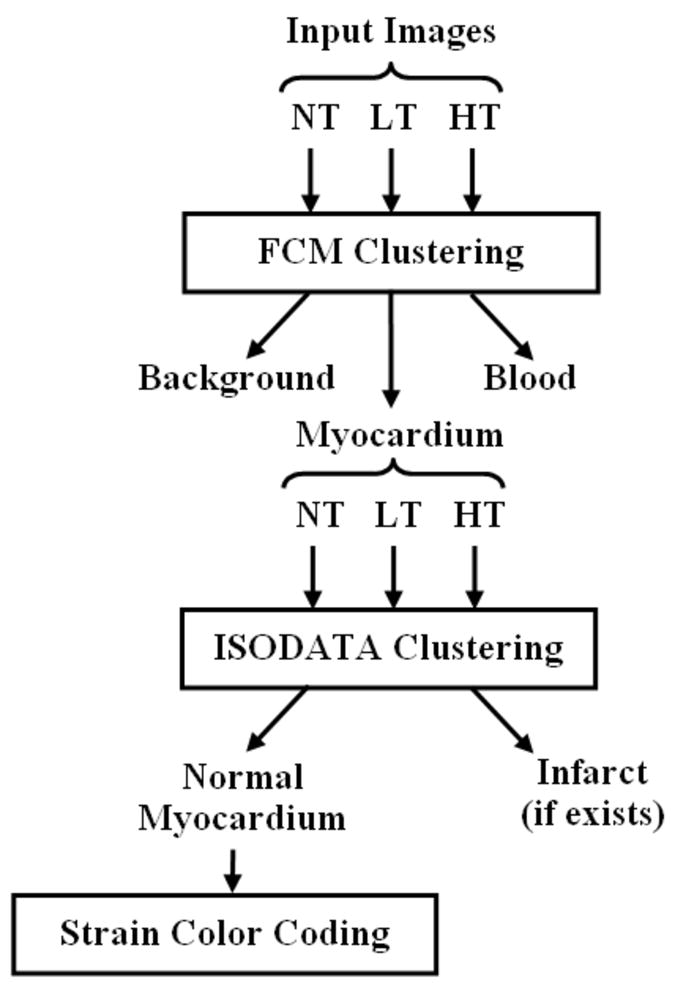
FIGURE 2.

Schematic diagram of the clustering method. The method consists of three stages. In the first stage, the fuzzy c-means (FCM) algorithm clusters the image into three main clusters: blood, myocardium, and background. In the second stage, the iterative self-organizing data (ISODATA) algorithm further clusters the myocardium into non-infarcted and infarcted myocardium. Finally, each pixel in the cluster of non-infarcted myocardium is given certain grade of color based on strain.
