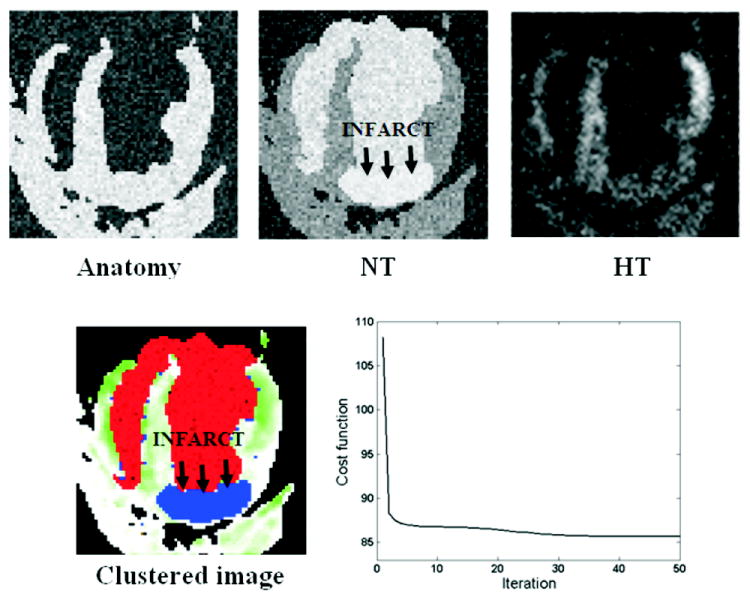
FIGURE 3.

Simulated C-SENC MRI images and the resulting clustered image. Bright regions in the anatomy, NT, and HT images represent: tissue (contracting and non-contracting), infarct (or blood), and contracting myocardium, respectively. Red and blue in the clustered image represent blood and infarct, respectively. Non-infarcted myocardium is assigned different grades of green based on strain (green and white represent minimum and maximum strain, respectively). The FCM objective cost function is also shown in the figure.
