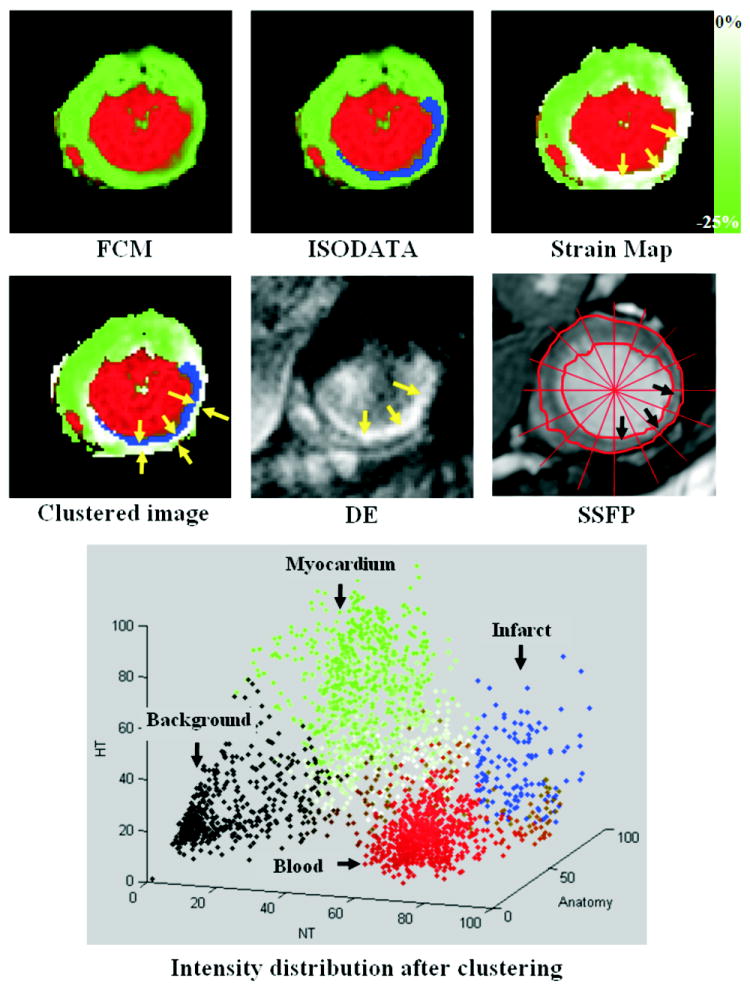
FIGURE 5.

Results of clustering the images in figure 4 (small ROI around the heart is considered). The figure shows the results after applying each stage of the clustering algorithm, as well as the NT-HT-Anatomy intensity distribution of the clustered image (0 and 100 represent no signal and the maximum signal intensity, respectively). The FCM stage clusters the image into blood (red), myocardium (green), and background (black). The ISODATA stage then clusters the myocardium into infarcted (blue) and non-infarcted (green) tissues. Finally, the non-infarcted myocardium is given different grades of green based on strain (green = maximum strain, white = no strain). The arrows in the strain map point to the affected region with poor myocardial strain. The final clustered image is shown in the second row. The corresponding delayed-enhancement (DE) and SSFP images are also shown. The arrows point to the infarct (blue) and the adjacent non-contracting (and non-infarcted) myocardium (outer arrows in the final clustered image). There is a good agreement between the infarcted region in the clustered and DE images. The SSFP image shows a remarkable decrease in myocardial thickening at end-systole in the affected region (arrows) compared to the non-affected regions.
