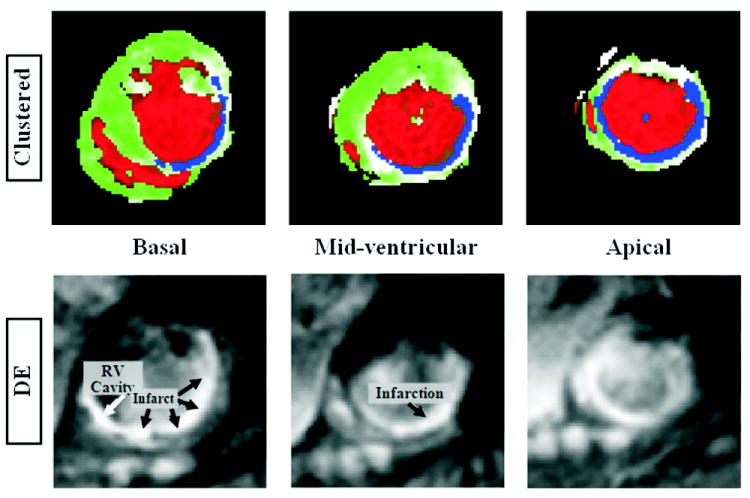
FIGURE 6.

An example of a multi-slice infarct. Apical, mid-ventricular, and basal short-axis slices are shown. Top and bottom rows show the clustered and delayed-enhancement images, respectively. The basal DE slice shows bright infarct and blood, which hinders correct identification of the infarcted region. This is not the case in the corresponding clustered image because of the black-blood property in the resulting SENC images.
