Figure 1.

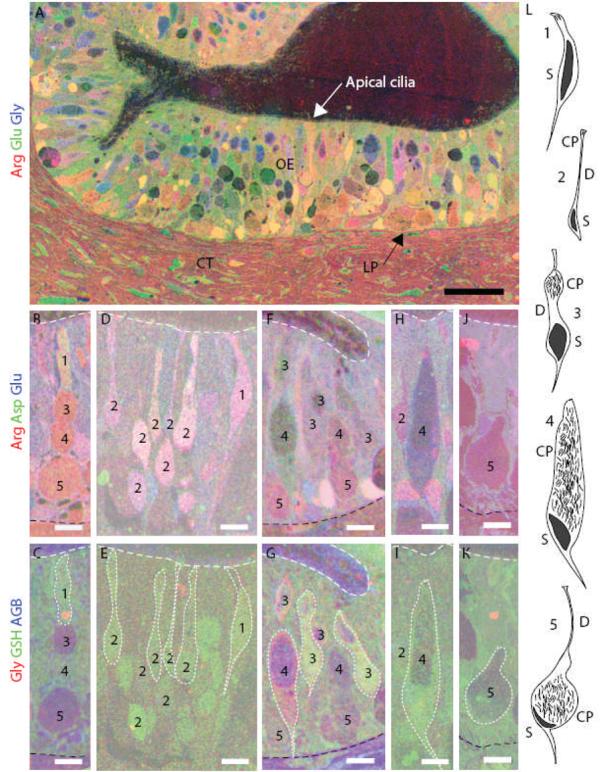
Identification of the five morphological types of squid ORNs using metabolite profiles and location. (A) Thin sections through the squid OE were immunostained and superimposed. An RGB image shows levels of arginine (red), glutamate (green) and glycine (blue) in neurons and epithelial (support) cells. A basement membrane (arrow) separates the OE from the lamina propia (LP) and connective tissue (CT) (scale bar = 50 μm). (B,D,F,H,J) arginine = red, aspartate = green and glutamate = blue. (C,E,G,I,K) the same cells as in B, D, F, H and J; glycine = red, GSH = green, AGB = blue. White dotted line outlines some of the ORNs. (B-C) Type 1 ORN. (D-E) Type 2 ORNs. (F-G) Type 3 ORNs. (H-I) Type 4 ORN. (J-K) Type 5 ORN. White dashed line indicates the apical edge of the OE. Black dashed line indicates the basal limit of the OE in C, G and K. (L) Illustrations of the morphology of the five ORN types (redrawn from Emory 1975). CP, cilia pocket; D, dendrite; S, soma. Black region in each cell is the nucleus. (B-K), scale bars = 10 μm.
