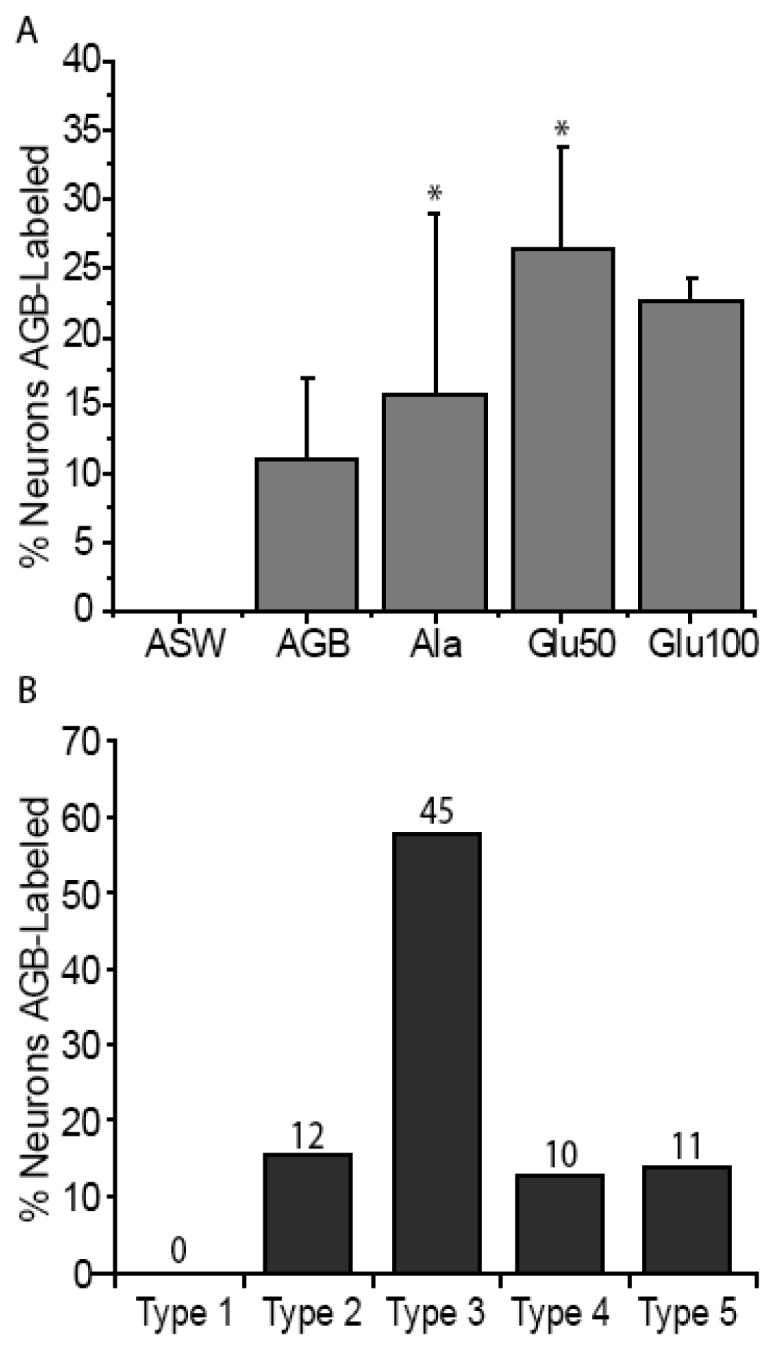
Figure 4.

Odor responsiveness and proportions from 389 squid ORNs. (A) Odors induce different percentages of AGB labeling; the mean ± S.E. percentages of the 389 identified ORNs labeled with AGB in response to the odorant is shown. There is a significant association between odorant (Ala and Glu50) and AGB labeling (asterisks; p < 0.05 chi-squared test). For each condition n = 3 olfactory organs. (B) The numbers indicate the AGB-labeled neurons within each type. The total number of cells for each cell type in B is divided by the 78 cells labeled. Type 3 cells had the highest percentage of AGB labeling in response to odorant stimulation.
