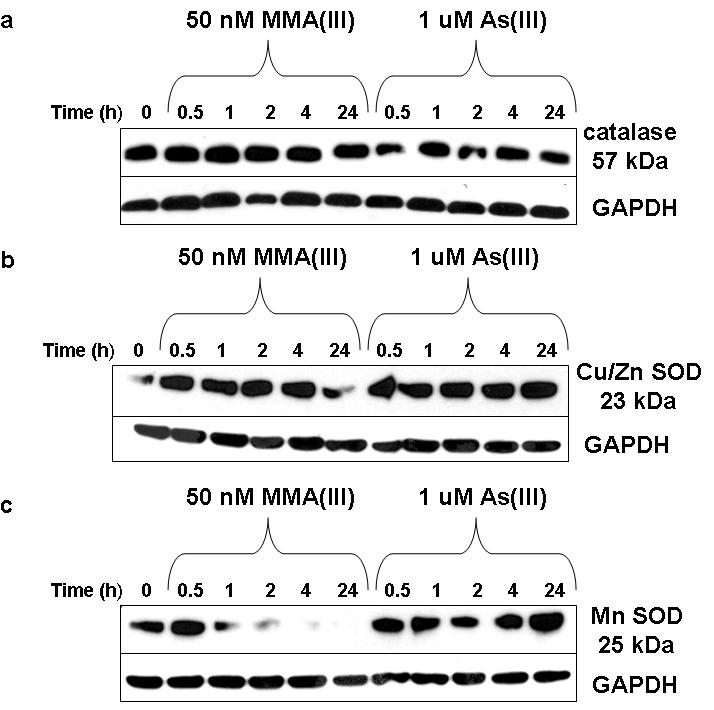
Figure 5.

Changes in protein levels of antioxidant enzymes after acute, low-level arsenical treatment in UROtsa cells. A) Representative western blot (N≥3) shows that there is little change in catalase protein levels after either 50 nM MMA(III) or 1 μM As(III) from 0-24 h. B) Representative western blot (N≥3) shows that after either 50 nM MMA(III) or 1 μM As(III), the only changes seen is a decrease in SOD1 after 24 h of exposure to MMA(III). C) Representative western blot (N≥3) shows that there is a noteable decrease in SOD2 levels after 2 h of 50 nM MMA(III) treatment. Conversely, there is little change in SOD2 protein levels after 1 μM As(III) from 0-24 h. GAPDH serves as loading control.
