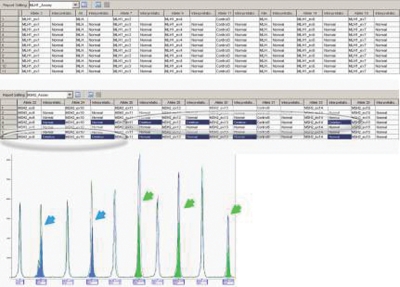
FIGURE 5.
This assay amplified MLH1 and MSH2 genes in the same reaction. The Report Manager allowed the user to edit MLH1 and MLH2 results in two separate reports by a single click on the Report Setting menu. Plots view of deleted MSH2 exon 9 and 10 for sample 7 (line 7, blue arrows), and deleted exons 11–14 for sample 4 (line 4, green arrows). Please note a normal pattern for the MLH1 gene.

