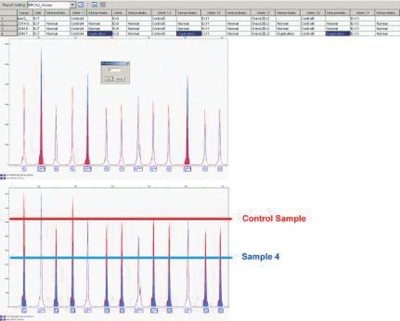
FIGURE 6.
Report Manager showed unexpected results for sample 4, where all control peaks were flagged “duplicated.” The DyeScale feature allowed the user to manually adjust sample normalization. After DyeScale correction (coefficient 0.7 in this case), this profile showed a complete BRCA2 gene deletion.

