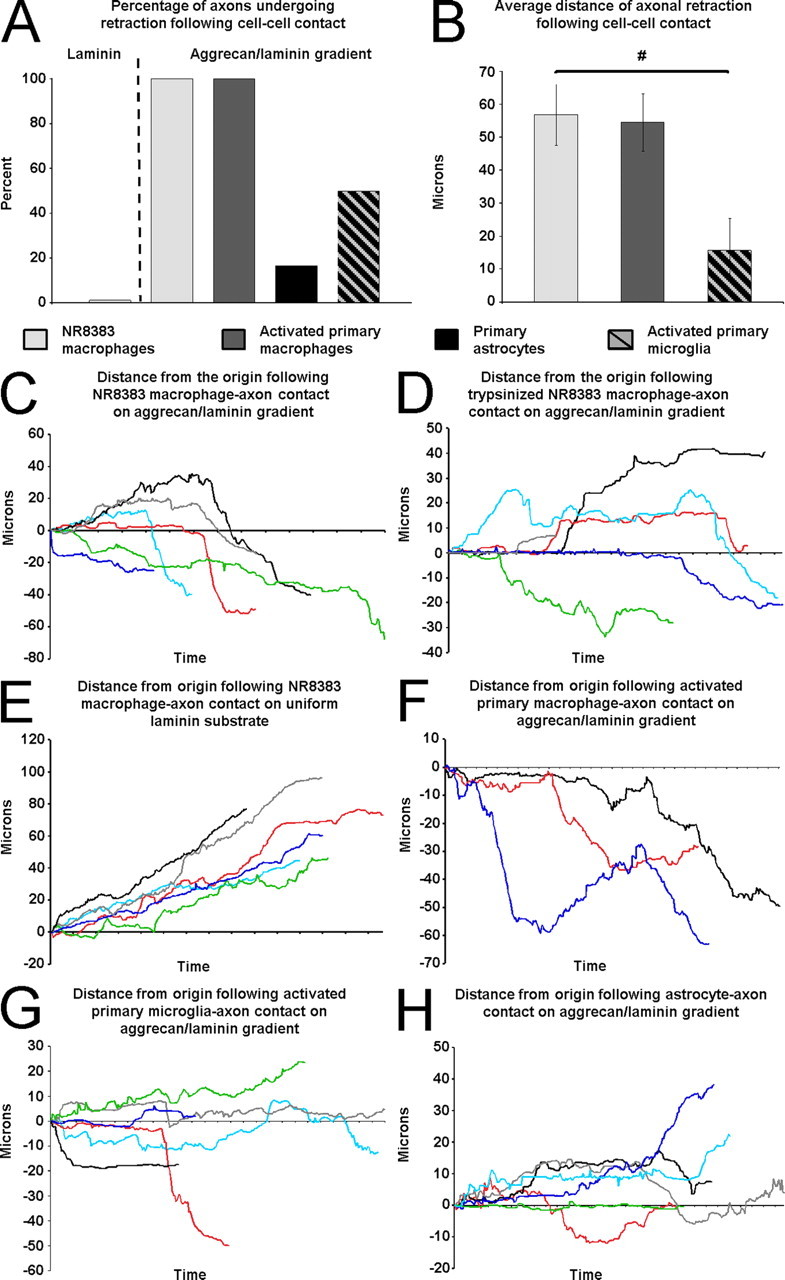
Figure 9.

Analyses of time-lapse experiments. A, The percentage of axons in each group that retracted >20 μm after cell–cell contact. B, The average distance of retraction after cell contact. Cell line macrophages are significantly different from activated primary microglia (general linear model, F (2,12) = 5.97, p = 0.016; Tukey's post hoc test, # p < 0.05). Error bars indicate SEM. C, The results of six experiments showing that six dystrophic axons on the aggrecan/laminin gradient retract after contact with NR8383 macrophages. D, The results of six experiments showing the responses of six dystrophic axons on the aggrecan/laminin gradient after contact with trypsinized NR8383 macrophages. E, The results of six experiments showing that axons continue to extend on a uniform laminin substrate after contact with NR8383 macrophages. F, The results of three experiments showing that three dystrophic axons on the aggrecan/laminin gradient retract after contact with activated primary bone marrow-derived macrophages. G, The results of six experiments showing that axons on the aggrecan/laminin gradient have mixed responses to microglia contact. H, The results of six experiments showing that dystrophic axons on the aggrecan/laminin gradient maintain their position after astrocyte contact.
