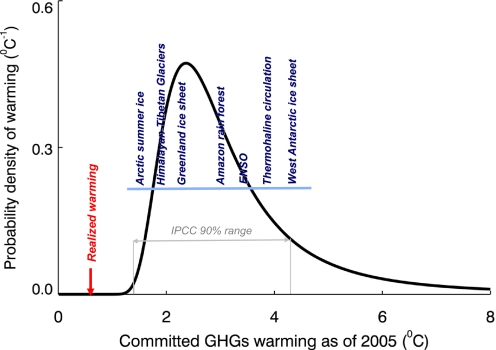
Fig. 1.
Probability distribution for the committed warming by GHGs between 1750 and 2005. The normalized distribution is calculated from the probability density function given by Roe and Baker (7), and the mean and standard deviation of the uncertainties associated with feedback processes are fitted for Sanderson et al. (8). Shown are the climate-tipping elements and the temperature threshold range that initiates the tipping. Except those for the HKHT glaciers, the rest of the elements and the temperature thresholds are taken from ref. 6. ENSO, El Niño—Southern Oscillation.

