Fig. 1.
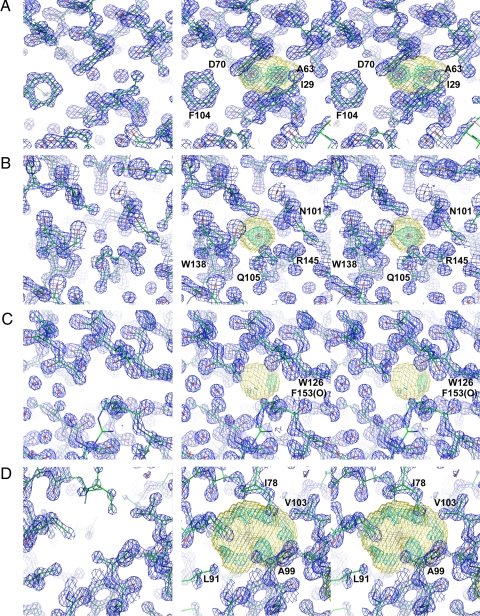
Electron density for hydrated and nonhydrated cavities in M102L/L99A lysozyme. (Left) The mono image shows the electron density corresponding to the crystallographically refined model. Coefficients are (2Fo−Fc)exp iαc, where Fc and αc are the amplitude and phase calculated from the refined model with solvent molecules included and marked with a red cross. The resolution is 1.25 Å, and the blue contours are drawn at 1.0e/Å3. (Right) The stereo pair shows the 1.25-Å resolution experimental electron density. Coefficients are mFo exp iα, where m is the figure of merit and α the experimental phase angle, and the map was scaled as described in Methods. The shape of the cavity is shown in yellow. Outside the cavity the electron density is contoured in blue at 1.0e/Å3 (the same as in Left). Inside the cavity the electron density is contoured in cyan at 0.4e/Å3 and in red at 3.0e/Å3. (A) Cavity 1 has two well ordered water molecules seen in conventional crystallographic refinement (Left) and in the experimentally phased map (Right). (B) Cavity 2 has a single well ordered water molecule. (C) Cavity 3 appears to lack solvent in conventional crystallographic refinement (Left) and also has essentially zero electron density in the experimentally phased map (Right). (D) Cavity 4. In the experimental map there is weak electron density distributed around the periphery of the disk-shaped cavity. One of the three highest peaks is 2.4 Å from the carbonyl oxygen of Ala-99, another is close to the β-carbon of Ala-99, and the third is within the elongated peak close to the side chain of Leu-91. This figure was prepared with PyMOL (43).

