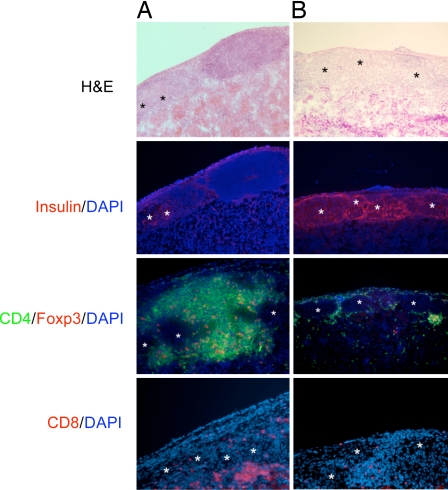
Fig. 2.
Graft histology. Protected grafts at day 14 (A) and day 70 (B) after transplantation were stained with H&E, anti-insulin (red), CD4 (green), +Foxp3 (red), and CD8 (red). DAPI staining is shown in blue. Graphs are representatives of at least four sectioned and stained grafts of each group. Magnification × 100. Asterisks indicate intact islets.

