Figure 1.

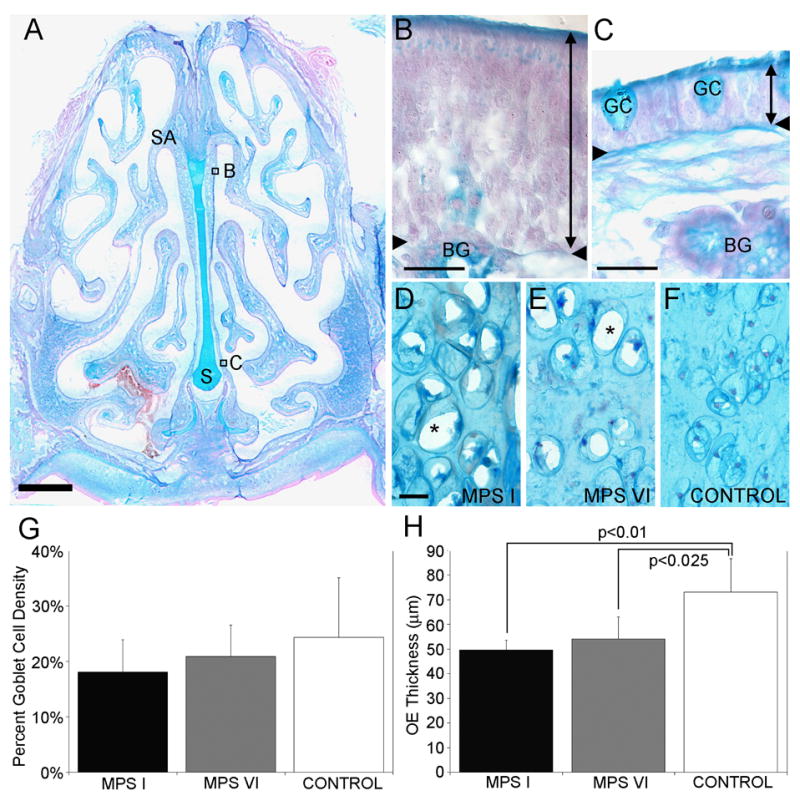
Anatomy and morphometry of the OE in MPS-affected and control cats. A. A coronal cross-section of a control cat stained with alcian blue and nuclear fast red. The ventral aspect of the septal arch (SA) is lined with sensory OE, whereas the base of the septum (S) is lined with respiratory epithelium. Scale bar = 2mm. B. Higher magnification of the sensory OE consisting of supporting cells, ORNs, basal cells and the duct of Bowman’s glands (BG). The thickness of the OE was measured from the apical surface to the basement membrane (double-headed arrow line). The region of OE is indicated in Fig 1A. C. A higher magnification of the respiratory epithelium (double-headed arrow line) consisting of respiratory cells and goblet cells (GC). The region of respiratory epithelium is indicated in Fig 1A. D and E. In the nasal septum of affected MPS I and MPS VI animals, lysosomal storage was evident in chondrocytes, based on the presence of abundant clear vacuoles in the cytoplasm from which stored GAGs were lost during tissue processing (asterisks). F. In control animals, chondrocytes in the septum showed no evidence to lysosomal storage. G. The goblet cell density was not significantly different between MPS-affected and control cat RE. H. There were significant differences between the OE thickness of MPS I and control cats (p<0.01) and between MPS VI and control (p<0.25) cats. Mean ± standard deviation. Scale bars = 20 μm.
