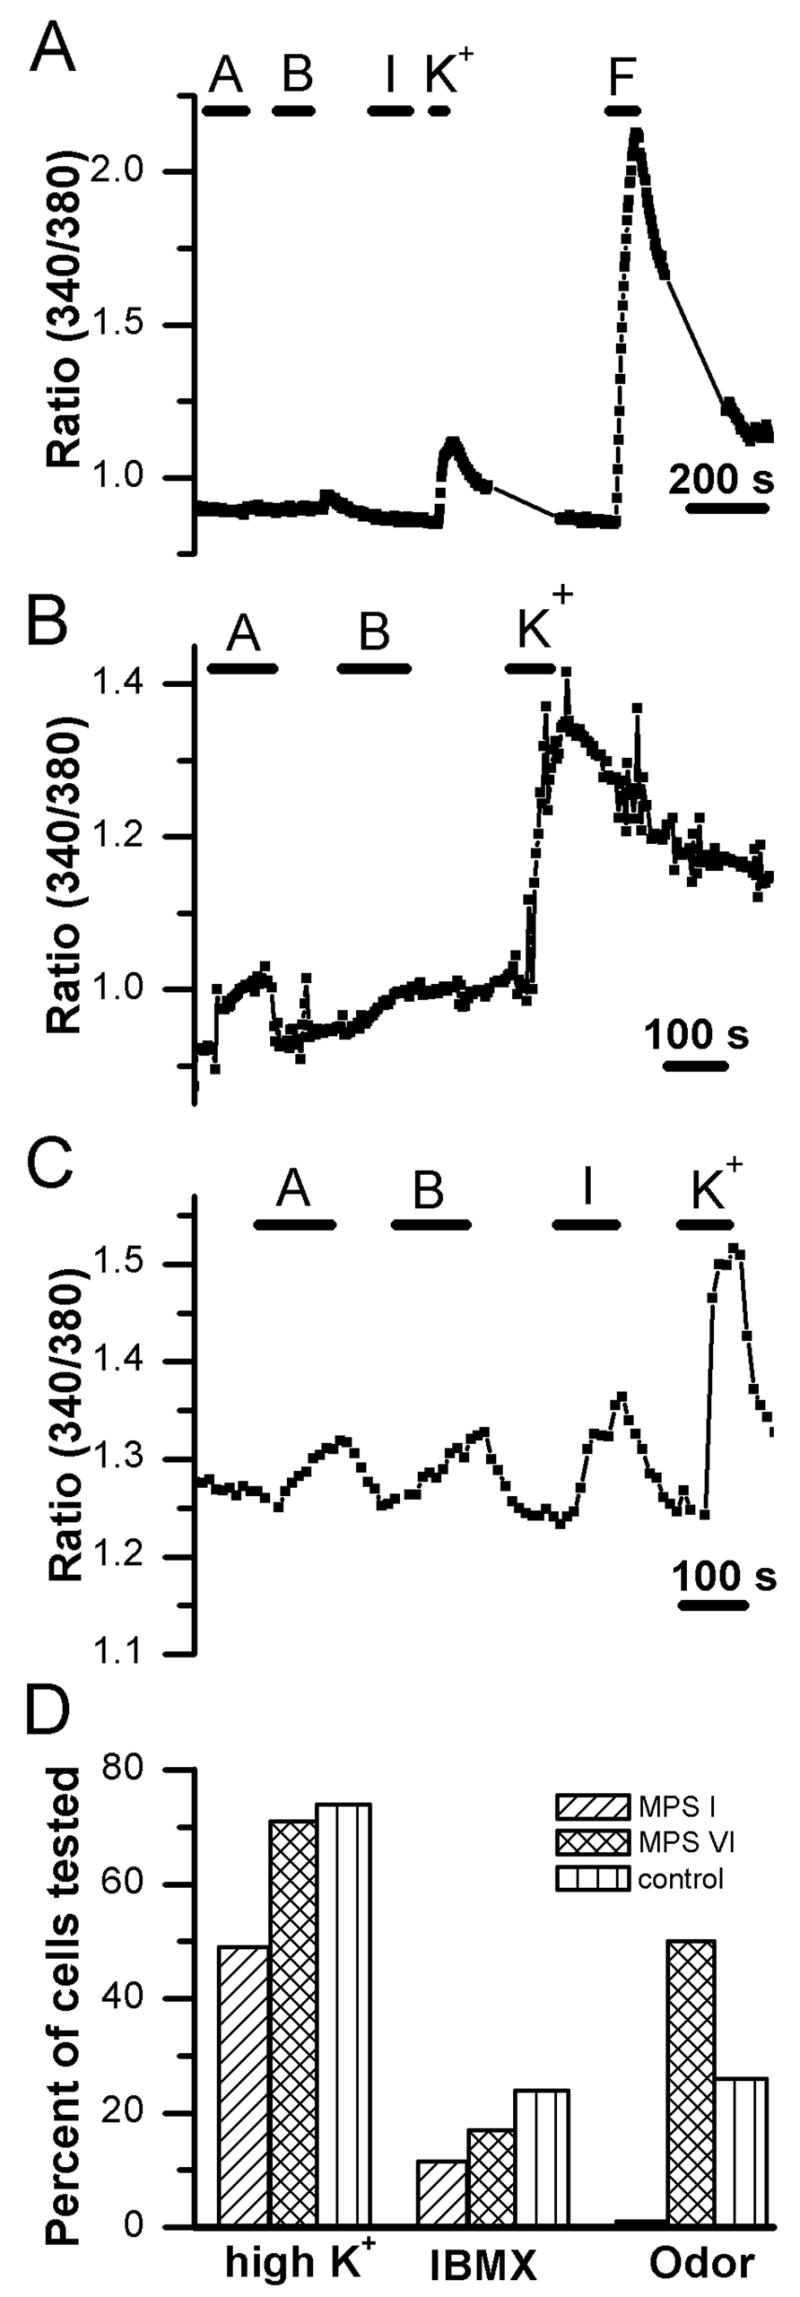
Figure 3.

Calcium imaging reveals differences in responsiveness to stimulation. A. Example of a trace showing fluorescence ratio values recorded from an ORN from an MPS I cat. The cell showed no [Ca2+]i increase to two odor mixtures or IBMX but had a small response to application of high potassium solution and a large [Ca2+]i increase to the adenylate cyclase activator forskolin. A = odorant mixture A; B = odorant mixture B, F = 20 μM forskolin; I = 1 mM 3-isobutyl-1-methylxanthine (IBMX); K+ = 135 mM potassium Ringer. B. Recording of an ORN from an MPS VI-affected cat. This cell exhibited a response to odor mixture A and to high K+ with no response to odor mixture B. C. Calcium levels increase in an ORN from a control animal in response to both odorant mixtures as well as to IBMX and to depolarization with high K+. D. Bar chart of response frequencies for the calcium responses to application of 135 mM potassium, IBMX, and odorant mixture A or B. Responsiveness to depolarization with high K+ was similar between MPS VI cats and controls but was lower in MPS I animals. There was also a trend for fewer cells from affected cats, both MPS I and MPS VI, to respond to IBMX, although this difference was not significant when considering within-animal correlation (see methods). The response frequencies to odorant mixtures were significantly different among groups with only 1 of 88 cells from the MPS I animals responding.
