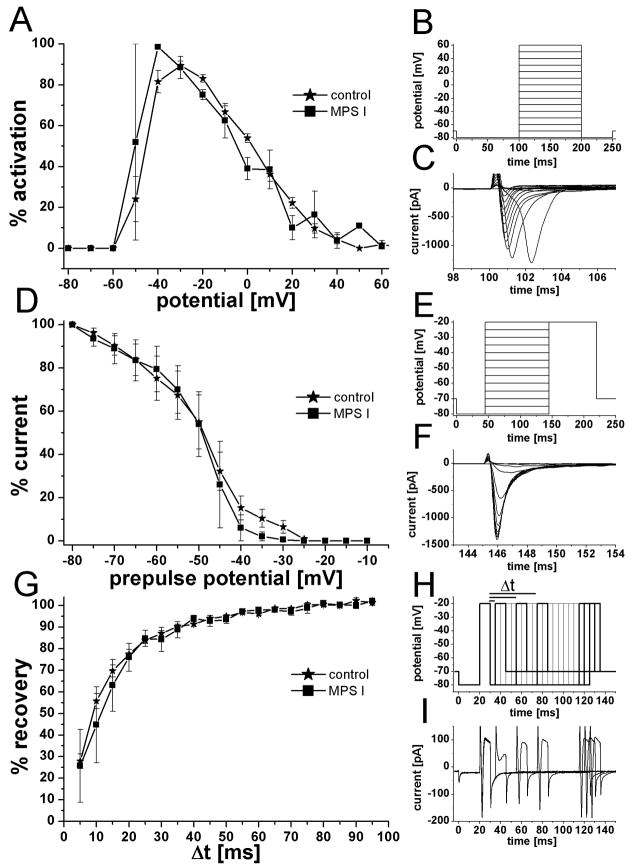
Figure 5.
Kinetics of voltage-activated sodium currents were similar in ORNs from MPS I-affected and control cats. A. Plot of sodium current activation vs. potential with the peak current for individual recordings set at 100% to normalize the data. B. Pulse protocol used to elicit sodium currents. Cells were held at −70 mV and, after a prepulse of −80 mV, the potential was stepped in 10 mV increments to +60 mV. C. Example of voltage-activated sodium current from a MPS I-affected ORN. The peak current was 1300 pA and was elicited at −40 mV. D. Plot of sodium current prepulse inactivation. Current amplitude of a test pulse after a prepulse potential of −80 mV was set a 100% to normalize the data. Half inactivation for the two groups was almost identical at −49 mV (−48.9 mV for control and −49.3 mV for MPS I). E. Pulse protocol for prepulse inactivation. Cells were held at −70 mV and briefly hyperpolarized to −80 mV. Prepulses were applied from −80 mV to +20 mV in 5 mV steps and the current amplitude was determined with a test pulse to +20 mV. F. Example of sodium currents elicited by the test pulse to + 20 mV; same ORN as in C. G. Recovery-from-inactivation plot showed no difference in recovery of the sodium current between the two groups. The amplitude of the current induced by a first voltage step was set as 100% and a second test pulse was applied with increasing time interval between the two. The % amplitude of the second response compare to the first was plotted against the time between pulses (Δt). H. Pulse protocol to determine time to recovery from inactivation. Membrane potential was stepped twice from −80 mV to −20 mV for 10 ms each and the time between the two pulses was increased in 5 ms steps. Bolder lines correspond to current traces in I. I. Examples for current traces recorded from an MPS I ORN. Time interval between the pulses for the shown traces was 5 ms, 35 ms, 45 ms, 85 ms, 90 ms, and 95 ms. While the sodium current is largely reduced after 5 ms recovery time, it fully recovered with longer time intervals.

