
Figure 3.
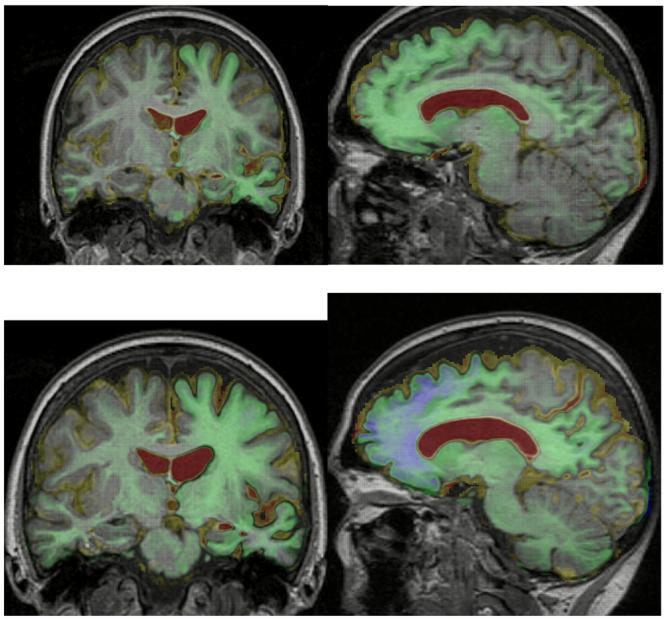
Sagittal and coronal MRI images of a patient with progranulin-associated frontotemporal lobar degeneration, with voxel-compression-mapping overlay over the time periods (A) from 6 months before to 6 months after symptom onset, and (B) 6–18 months after symptom onset. Red represents 20% or greater expansion of voxels and blue represents 20% or greater contraction of voxels.