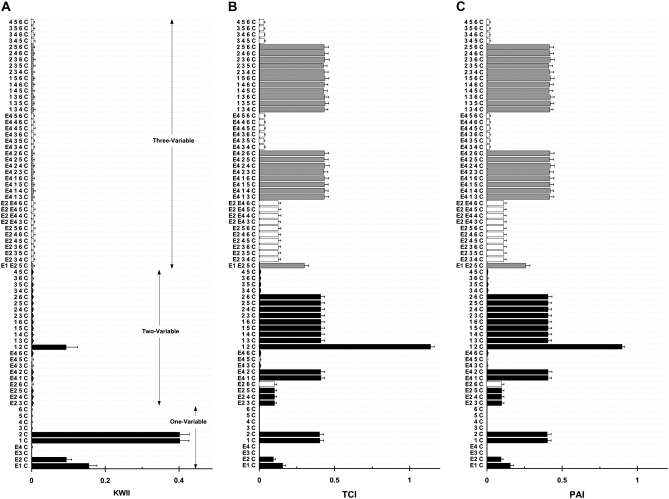
Figure 3.—
A, B, and C are the KWII, TCI, and PAI spectra for case study 1A, respectively. All the one-variable-containing combinations and the 20 two-variable and 20 three-variable combinations with the highest KWII values are shown. The environmental variables are shown as E1, E2, E3, E4, the SNP variables are numbered 1–6, and phenotype is indicated as C. The combinations are indicated on the y-axis. The error bars represent the standard deviations. The solid bars identify the peaks obtained by both the PAI-based AMBIENCE search algorithm and EXS methods, the open bars indicate the peaks obtained by the EXS alone, and the shaded bars indicate the peaks obtained by AMBIENCE alone.

