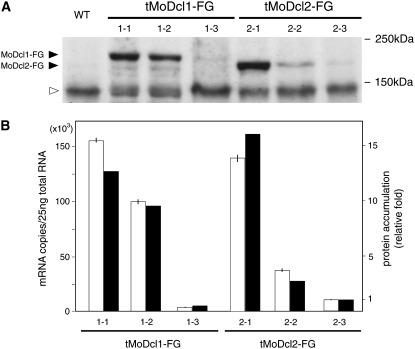
Figure 3.—
Western blot (A) and qRT–PCR (B) analyses of M. oryzae transformants overexpressing 3xFLAG-tagged MoDcl1 and MoDcl2. (A) By introducing synthesized oligonucleotides (ACCATGGACTACAAAGACCATGACGGTGATTATAAAGATCATGACATCGATTACAAGGATCATGATGGT) into the overexpression vectors using a PCR-based cloning strategy, we constructed N-terminally 3xFLAG-tagged MoDcl1 (MoDcl1-FG) and MoDcl2 (MoDcl2-FG). Mycelia of tMoDcl1-FG and tMoDcl2-FG were homogenized in buffer composed of 50 mm Tris-HCl (pH 7.5), 150 mm NaCl, and 1% Nonidet P-40. The homogenates were centrifuged (10,000 × g, 10 min) and the supernatants were collected. Equal amounts of homogenate protein (75 μg) were applied to 10% SDS–polyacrylamide gel electrophoresis (PAGE), electroblotted onto a Immobilon-P PVDF membrane (Millipore, Bedford, MA), and probed with an anti-FLAG M2 monoclonal antibody (Sigma, St. Louis). Proteins reacting with the antibody were visualized with ECL plus Western blotting detection reagents (GE Healthcare, Piscataway, NJ). The wild-type (WT) strain, Br48, was used as a control. (B) The transformants used in the Western blot analysis were subjected to qRT–PCR as described in the legend of Table 1. On the basis of qRT–PCR, the copy numbers of the transcripts per total RNA quantity were determined with reference to the standard plasmids (open bars). To estimate protein accumulation levels in A, the X-ray film was scanned and densitometrically analyzed with the 1D Quantifier software (Phoretix). Accumulation levels of MoDcl1-FG and MoDcl2-FG protein were normalized with the levels of a nonspecific protein signal (open triangle in A). Relative fold of protein accumulation (solid bars) was calculated with reference to the data of a dilution series (threefold) of MoDcl1-FG protein (data not shown).

