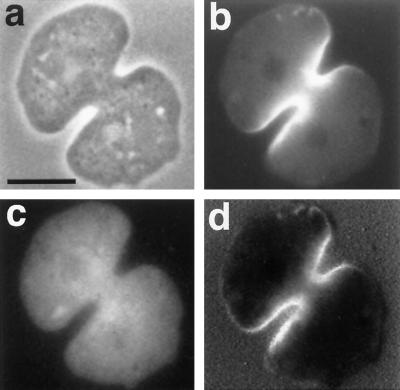
Figure 2.
Distribution of IAF-labeled myosin and rhodamine-labeled BSA in the same cell. Phase-contrast micrograph (a) and fluorescence micrographs showing distribution of IAF-labeled myosin (b) and rhodamine-labeled BSA (c). (d) Ratio of intensities of fluorescence from IAF and rhodamine. Bar, 10 μm.

