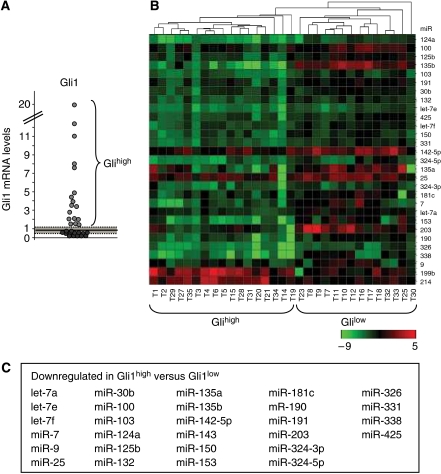
Figure 1.
Differential expression of miRNAs in Gli1high versus Gli1low expressing MBs. (A) Gli1 mRNA levels in human MBs. Average (continuous line)±2 s.d. (dashed area) levels of Gli1 mRNA in normal adult cerebellum. Gli1high tumours have Gli1 mRNA levels 2 s.d. above the mean value of normal adult cerebellum. (B) Heat map clustering of miRNAs in human MBs. A green–red colour scale depicts normalized miRNA expression levels. (C) List of miRNAs in which the expression is downregulated in Gli1high versus Gli1low MBs.

