Figure 1.
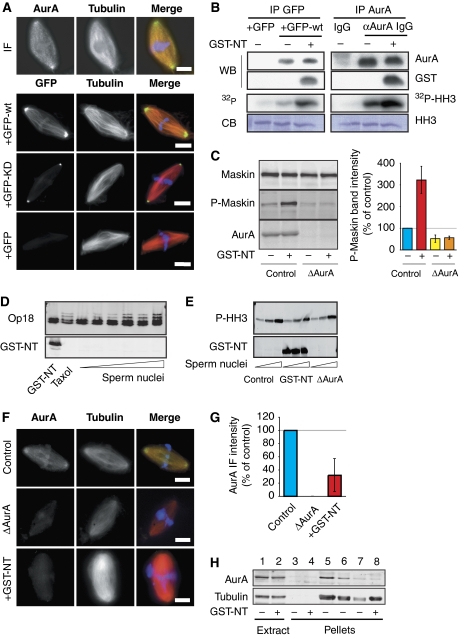
AurA localization and activation in Xenopus egg extract. (A) Localization of AurA on spindles assembled in cycled egg extract. The endogenous kinase was detected by immunofluorescence using the polyclonal affinity-purified anti-AurA antibodies (upper panels). The localizations of GFP, GFP-AurA (GFP-wt) and GFP-AurA (D281A) (GFP-KD) are shown in the lower panels. In the merged images, AurA and GFP are in green, MTs are in red and DNA is in blue. Bars, 10 μm. (B) GST-NT activates recombinant and endogenous AurA after IP from the egg extract. Left panels: GFP or GFP-wt was incubated in CSF extract as indicated and immunoprecipitated with anti-GFP antibodies (IP GFP). The IP proteins were analysed by western blot (WB) using anti-AurA (AurA) and anti-GST (GST) antibodies. In parallel, the kinase activity of the IP proteins was tested on HH3 in vitro. The autoradiography (32P-HH3) of the Coomassie-stained gel (CB) is shown. Right panels: endogenous AurA was immunoprecipitated with anti-AurA antibodies from egg extract as indicated. The IP proteins were analysed as described above. (C) GST-NT increases Maskin phosphorylation by AurA on Ser626. Western blot of control and AurA depleted (ΔAurA) M-phase cycled extract as indicated, and probed with an anti-Maskin (Maskin), anti-phospho-Maskin (P-Maskin) and anti-AurA (AurA) antibodies. The graph on the right shows the quantification of the phospho-Maskin band intensities normalized with the band of total Maskin and shown as percentages of control. The data are the mean of three independent experiments. Error bars stand for s.d. (D) GST-NT does not promote Op18 hyperphosphorylation. Western blot analysis with an anti-Op18 antibody (Op18) and an anti-GST (GST-NT) of CSF extract incubated with GST-NT, 20 μM taxol or increasing concentrations of sperm nuclei (1, 2, 5, 10 and 20 nuclei per nanolitre). (E) GST-NT addition does not increase HH3 phosphorylation. Western blot analysis with anti-phospho-HH3 (P-HH3) and anti-GST (GST-NT) antibodies of CSF extract: mock (control) containing GST-NT (GST-NT) or AurA depleted (ΔAurA) and incubated with increasing concentrations of sperm nuclei (1 and 10 nuclei per nanolitre). (F) GST-NT displaces AurA from the spindle. Representative images of the localization of AurA detected by immunofluorescence with the anti-AurA antibodies. Three conditions are shown: spindles assembled in control extract, extract containing GST-NT and in AurA-depleted extract. In the merged images, AurA is in green, MTs are in red and DNA is in blue. Bars, 10 μm. (G) Total AurA fluorescence intensities associated with the spindles formed in (F). The background fluorescence intensity detected in ΔAurA was substracted from the values obtained in the other conditions. The fluorescence intensity of the control was set at 100%. The graph shows the mean of two independent experiments. Error bars stand for s.d. (H) Western blot analysis of mitotic structures assembled around sperm nuclei in cycled extracts, in the absence or presence of GST-NT. The initial extracts are shown. The blots were probed with the anti-AurA (AurA) and an anti-α-tubulin (tubulin) antibodies. The pellets from extracts containing nocodazole were used in parallel. 1 and 2: 1 μl of initial extracts; 3 and 4: pellets from 40 μl of extract containing nocodazole; 5–7: pellets from 40, 20 and 10 μl of extract, respectively; 8: pellet from 40 μl of extract containing GST-NT.

