Figure 2.
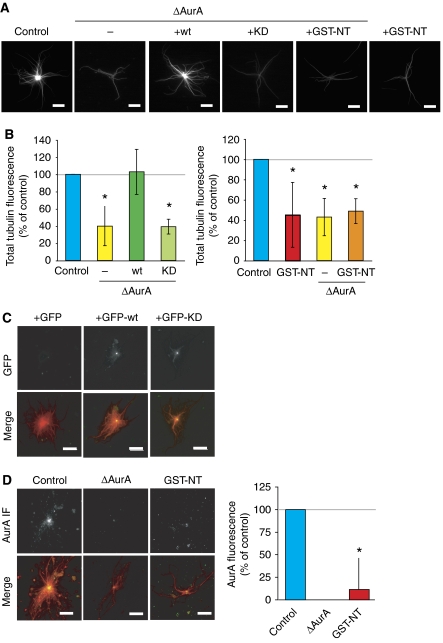
Role of AurA on centrosomal aster formation in egg extract. (A) Representative images of asters formed by purified centrosomes in mock-depleted (control) extract, AurA-depleted extract (ΔAurA), AurA-depleted extract containing recombinant AurA (+wt), kinase-dead AurA (+KD) or GST-NT (+GST-NT) and mock-depleted extract containing GST-NT (+GST-NT). Bars, 10 μm. (B) Total tubulin fluorescence associated with asters assembled as in (A). The fluorescence intensity of control asters was set at 100%. The mean results from three independent experiments are shown. Error bars stand for s.d. *P<0.05 compared with control. (C) AurA localizes to the centre of centrosomal asters independently of its activity. Asters were formed in the presence of GFP, GFP-wt or GFP-KD at 150 nM final concentration. In the merge GFP is in green, MTs are in red. Bars, 20 μm. (D) GST-NT displaces AurA from the centrosomal asters. Representative pictures of AurA localization in MT asters formed by centrosomes in mock (control), AurA-depleted extracts (ΔAurA), or in extracts containing GST-NT (GST-NT). AurA is detected by immunofluorescence with the anti-AurA antibodies. The merge shows MTs in red and AurA in green. Bar, 20 μm. The graph shows the quantification of AurA fluorescence intensity at the centre of asters formed in different conditions. The background fluorescence measured in ΔAurA extracts was substracted from the values obtained in the other conditions and the AurA fluorescence intensity of the control was set to 100%. The average values from three independent experiments are shown. Error bars stand for s.d. *P<0.05 compared with control.

