Figure 3.
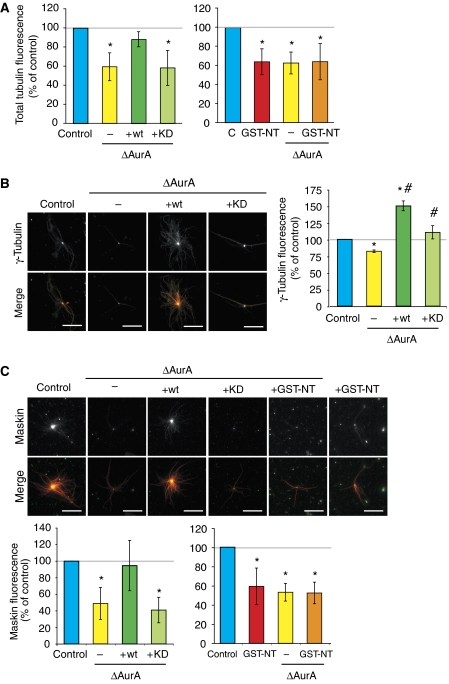
AurA depletion decreases the intrinsic nucleation capacity of centrosomes. (A) Quantification of the MT nucleation capacity of sperm centrosomes reconstituted in egg extract. Mock-depleted extract (control), AurA-depleted extract (ΔAurA) AurA-depleted extract with wt AurA (+wt) or with kinase-dead AurA (+KD), mock-depleted extract with GST-NT (+GST-NT). The total tubulin fluorescence was measured for more than 50 structures for each condition and the control was set to 100%. The graphs show the mean of three independent experiments. Error bars stand for s.d. *P<0.05 compared with control. (B) Quantification of γ-tubulin recruitment to centrosomes incubated in extracts. Left, immunofluorescence with an anti-γ-tubulin antibody. Mock-depleted (Control) extract, AurA-depleted extract (ΔAurA), AurA-depleted extract containing recombinant wt AurA (+wt) or kinase-dead AurA (+KD). Right, quantification of the fluorescence signal for γ-tubulin measured in a constant area at the centre of asters. The fluorescence intensity in the control was set at 100%. The graph shows the mean of two independent experiments. Error bars stand for s.d. *P<0.05 compared with control. #P<0.05 compared with ΔAurA. In the merge, γ-tubulin is in green, MTs are in red. Bars, 20 μm. (C) Quantification of Maskin recruitment to centrosomes incubated in extracts as in (B). Upper panels: immunofluorescence with an anti-Maskin antibody. Lower panels, quantification of the fluorescence signal for Maskin measured in a constant area at the centre of the asters. The fluorescence intensity in the control was set at 100%. Graph shows the mean of three independent experiments. Error bars stand for s.d. *P<0.05 compared with control. In the merge, Maskin is in green, MTs are in red. Bars, 20 μm.

