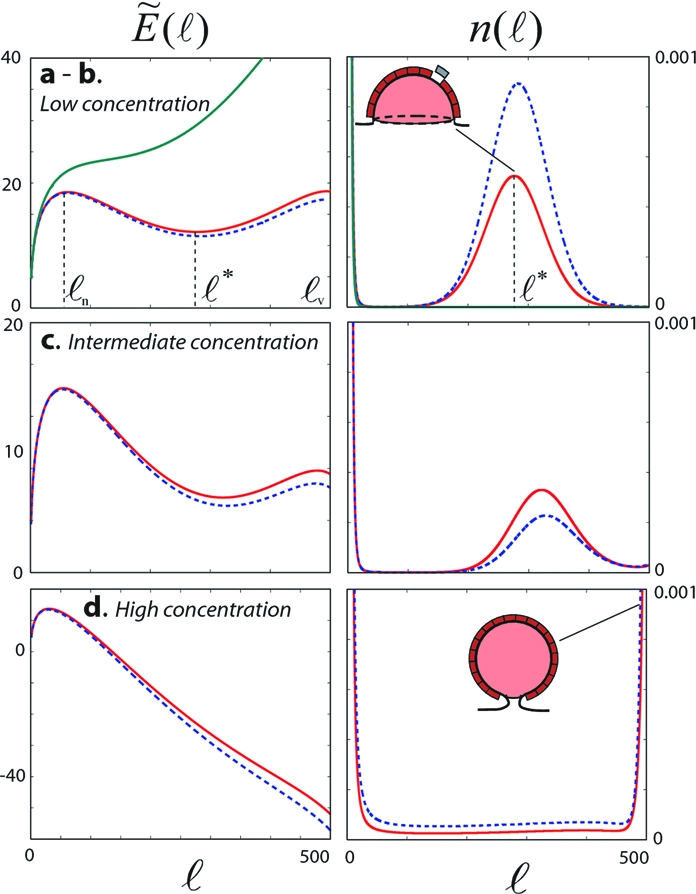
Fig. 2.

Effective energy landscape (ℓ) (Left, in kBT units, from Eq. 6) and the corresponding coat size distribution n(ℓ) (Right, in n1cmc units, from Eqs. 5–10), for different values of the free monomer density n1. n1/n1cmc = 0.986 (state a - Top green curve), 1.039 (state b - Top red), 1.054 (state c - Middle) and 1.160 (state d - Bottom). The variation of (ℓ) and n(ℓ) upon a slight increase of n1 above the given value are shown in blue dashed lines. Other parameters are γ = 5 kBT, σ = 0, kv = 0.13s−1, koff = 0.12s−1, and ℓv = 500. With those values, n1cmc = 0.009.
