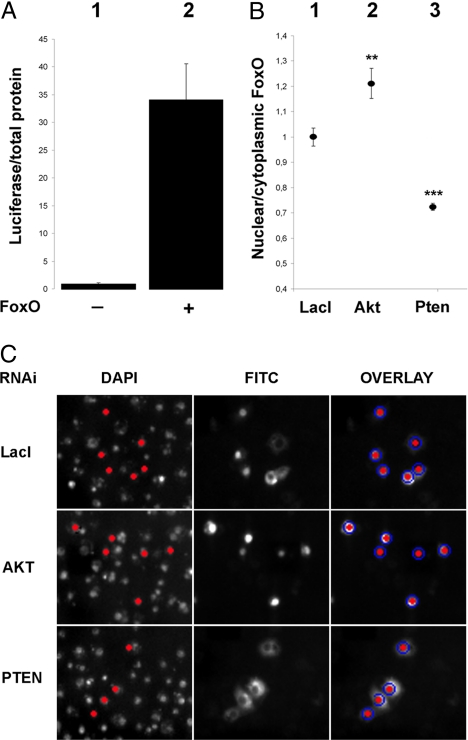
Fig. 1.
Secondary screen controls. (A) Overexpression of the WT dFoxO in S2 cells induces the expression of a luciferase reporter under the dInR promoter. (B) Conditions for the dFoxO subcellular localization detection were tested with known insulin signaling components AKT and PTEN. (C) Representative high-throughput microscope images are shown. The nuclei were identified by DAPI staining and selected for analysis based on the nuclear FITC intensity (dFoxO) exceeding the background level (red nuclei). The nuclear FITC intensity was measured from the area of DAPI staining (red nuclei) and from the surrounding cytoplasm (blue circles). **, P < 0.01; ***, P < 0.001.

