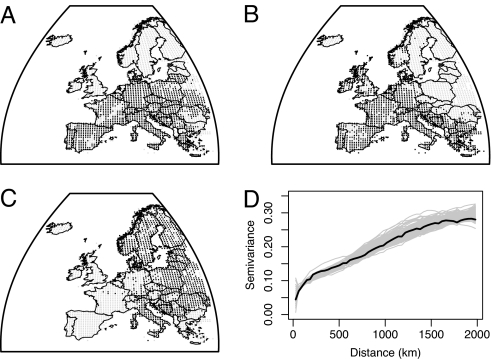
Fig. 1.
Output from the null distribution algorithm. (A) Real distribution (Serinus serinus) with presence indicated in black, absence in gray. (B and C) Two realizations of the null distribution. (D) Semivariograms of the real distribution (black) and 99 simulations (thin gray): note that the real distribution falls entirely within the null distributions.

