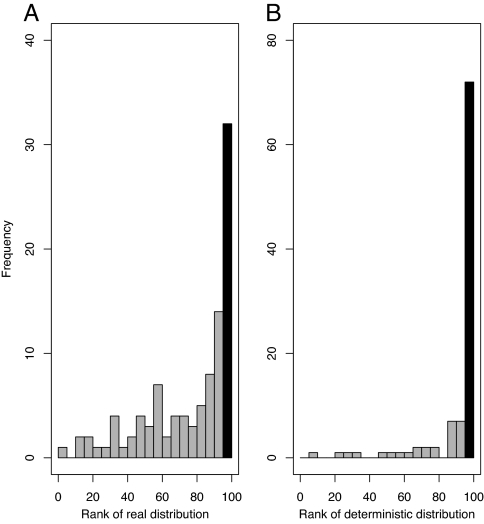
Fig. 2.
Histograms of ranked climate envelope AUC scores of 100 distribution patterns among 99 null models. (A) 100 real species distributions. (B) 100 semideterministic patterns used in the power analysis. Black bar indicates the number of species for which the AUC score for the distribution of interest was in the top 5% of randomizations: 32 species for real species, 72 for the power analysis.

