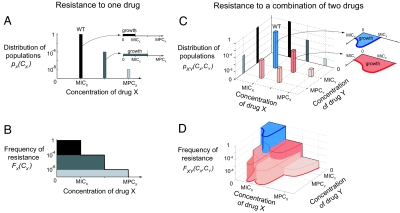
Fig. 3.
A mathematical model for multidrug resistance that incorporates resistance to the individual drugs, epistatic interactions, and cross-resistance. We demonstrate the model by considering a same hypothetical bacterial population subjected to a single drug X (A and B) or to two drugs X and Y combined (C and D). (A) The population is composed of wild-type (WT) and mutant cells that differ in their MICs of drug X. The positions and heights of the bars represent the MIC and the frequency of the corresponding subpopulation. (Inset) Each subpopulation can grow at any drug concentration below its own MIC. (B) The frequency of resistance to any given concentration CX is the sum of the frequency of the phenotypes that resist concentrations greater than CX. (C) The same population also analyzed with respect to another drug Y—the bacterial cells' MICs of X and MICs of Y define different subpopulations. Here, the population is made up of five phenotypes represented by 3D bars (blue, wild type; shades of red, mutants) positioned at their MICs of drugs X and MICs of drug Y. The height of each bar represents the frequency of the corresponding subpopulation. Note the projections of these bars onto the x–z plane (gray flat bars) are the three subpopulations obtained in A; similarly, the projections onto the y–z plane are the two subpopulations which differ by their MIC of Y. (Inset) The regions of drug space where each phenotype can grow (e.g., one of the mutants, red) are approximated by scaling the wild-type growth region (blue), which characterizes epistasis. (D) The frequency of resistance at any given concentration (CX, CY) is the sum of the frequencies of the phenotypes whose growth region contains the point (CX, CY). The MPC line (red) is the line above which no mutant can grow.

