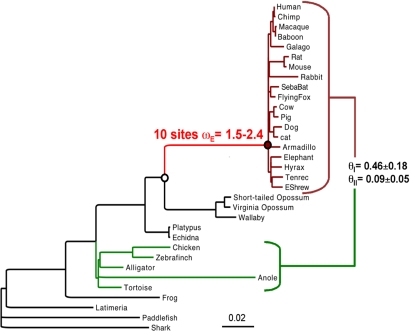
Fig. 2.
Positive selection on HoxA-11 exon 1 in the stem-lineage of placental mammals. Eutherians are shown in dark red, with the stem-lineage of eutherians in red. Ten sites were identified under positive selection with ωE = 1.5–2.4 depending on how codon frequencies were modeled (equal or empirical). Type I (θI) and type II (θII) functional divergence was estimated between eutherians and sauropsids (shown in green). θI, P < 0.01; θII, P < 0.05. Branch lengths are proportional to the number of nonsynonymous substitutions per codon. The red filled and white filled circles indicate the location of the ancestral eutherian and therian sequences recreated for functional tests.

