Fig. 1.
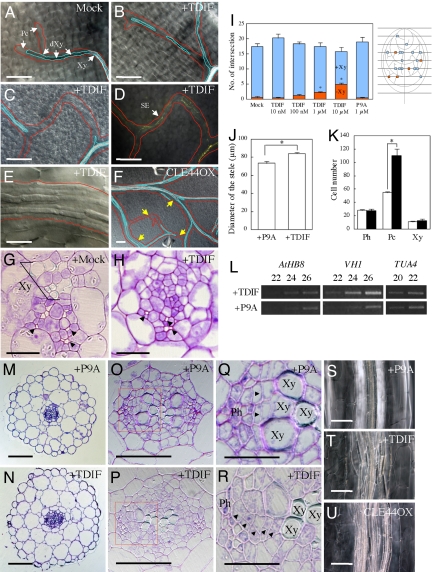
Vascular phenotypes caused by excess TDIF. (A–H) TDIF suppresses xylem vessel differentiation in the leaf vein. Pc, procambium; Xy, xylem vessel; dXy, differentiating Xy. (A and G) No peptide application. (B–E) Application of 1 μM TDIF. (H) Application of 10 μM TDIF. (B and C) Discontinuous xylem vessel. (D) Sieve elements (SEs) visualized by aniline blue in the same position as C. (E) Proliferated procambium cells in the region in which TE formation was suppressed. (F) Discontinuous xylem vessel formation in leaves of a CLE44-overexpressing plant; the yellow arrows show the non-TE region in the veins. Veins are outlined in red, and xylem vessels are outlined in blue. (G and H) Sections of the vein; xylem vessels are not often formed in veins of TDIF-treated seedlings. Arrowheads show SEs. (I) Dose-dependent suppression of TE formation in the veins by TDIF. (Right) A schematic illustration of the quantification method. The presence (+Xy) or absence (−Xy) of the xylem vessels was examined at the position where arbitrary transverse lines and veins of a high order crossed. (Left) Based on the method, veins with discontinuous xylem vessel strands were quantified in the presence of TDIF or P9A, an inactive derivative of TDIF. Blue boxes indicate veins with xylem vessels; red boxes, veins without xylem vessels. (J) TDIF enlarges the stele of hypocotyls. (K) The number of procambial cells but not phloem or xylem cells is increased by TDIF application. White boxes indicate P9A application; black boxes, TDIF application. (L) Procambium marker genes (AtHB8 and VH1) were up-regulated by TDIF application. (M–U) TDIF promotes procambial cell proliferation in the hypocotyl. (M, O, Q, and S) Application of 1 μM P9A. (N, P, R, and T) Application of 1 μM TDIF. (M–R) Toluidine blue-stained transverse sections of hypocotyls of 7-day-old Arabidopsis seedlings. (O and P) Magnification of the stele. (Q and R) Magnification of the boxed area in O and P. Arrowheads indicate the division plane of newly divided cells. (S–U) Hypocotyls of 10-day-old seedlings that were treated with P9A and TDIF and that were overexpressing CLE44. TDIF enhanced random division of procambium cells. (Scale bars: A–D, F, M, N, and S–U, 100 μm; E, G, H, Q, and R, 20 μm; O and P, 50 μm.) Error bars indicate SEM, n = 6 (I), 18 (J), and 7 (K). Asterisks indicate significant differences from mock/P9A application by Student's t test (P < 0.01).

