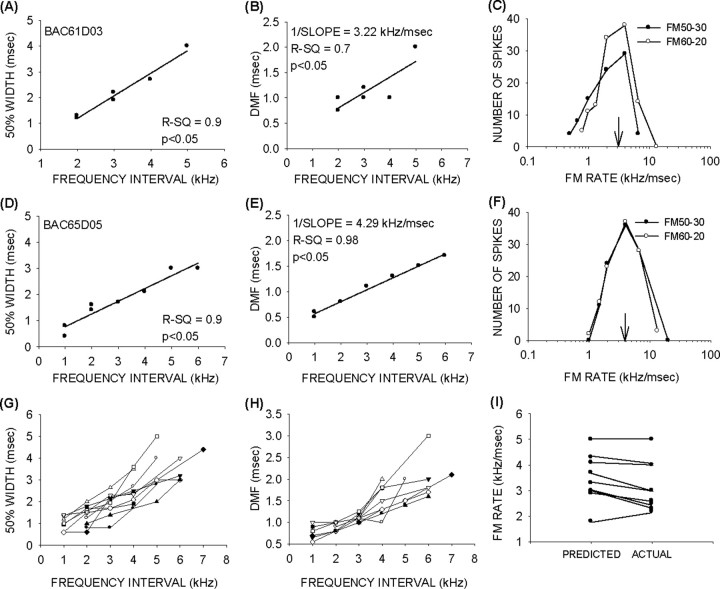
Figure 11.
Best rate predictions. A, B, D, E, The relationship between frequency intervals and 50% width (A, D) and DMF (B, E) from two different neurons. B, C, E, F, The predicted BRs shown as the reciprocal of the slope of functions in B and E are closely matched to the actual BRs shown in C and F (arrows). G, H, Relationship of frequency interval and 50% width of facilitation curve (G) and DMF (H) in all 10 neurons. I, Predicted versus actual BR of 9 of 10 neurons from which facilitation curves were obtained at multiple frequency combinations. In one neuron, FM sweep selectivity was not recorded. The actual BR was therefore not known.

